
Trading Journal
Introduction
The Trading Journal lets you record, categorize, and analyze your trades to better understand what's driving your performance. It is a diagnostic tool to identify successful habits and areas needing improvement. The new version of IPT introduces new functionality to record all trades executed through the terminal, save comments on individual trades, apply tags to positions and visualize trading performance with new charting tools.
Getting Started: Automatic Recording of Trades
To begin logging trades automatically, the trading window must be connected to a trading service.
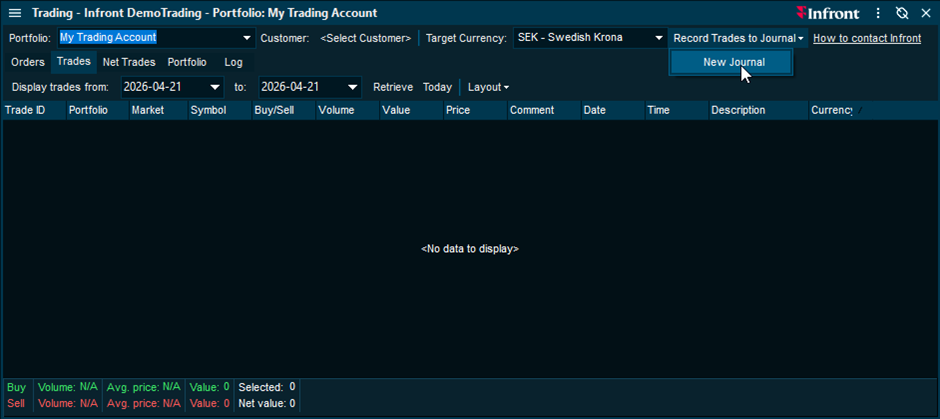
Open the Trading Window (Ctrl+Shift+O) and log in to your trading service. If you don't have a connected trading service, see Manual Recording below.
Click Record Trades to Journal.
Select New Journal from the dropdown menu.
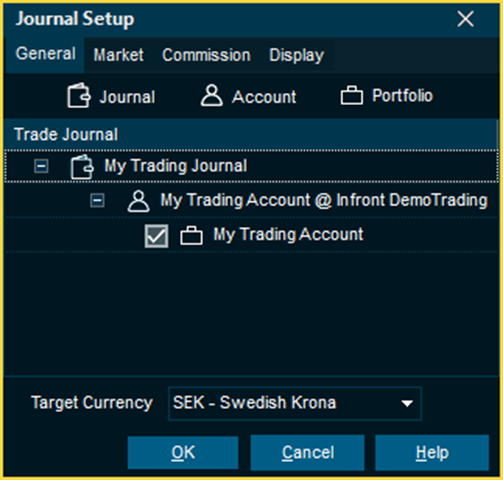
In the Journal Setup window, select the trading portfolios that should be recorded to the journal, provide a unique name for your journal and set a target currency.
Recording Modes: Automatic vs Manual
Automatic recording of trades: Once a journal has been configured from the Trading Window, the terminal will automatically log all trades in real time in the journal you just created.
Manual recording of trades: Trades can be entered manually into the Trading Journal if no trading service has been set up to record trades. To create a manual Trading Journal, open the main menu, select the Tools tab and select Trading Journal in the Trading column. In manual mode, each trade needs to be added manually by clicking on the Add Trade icon.
Open and Closed Positions
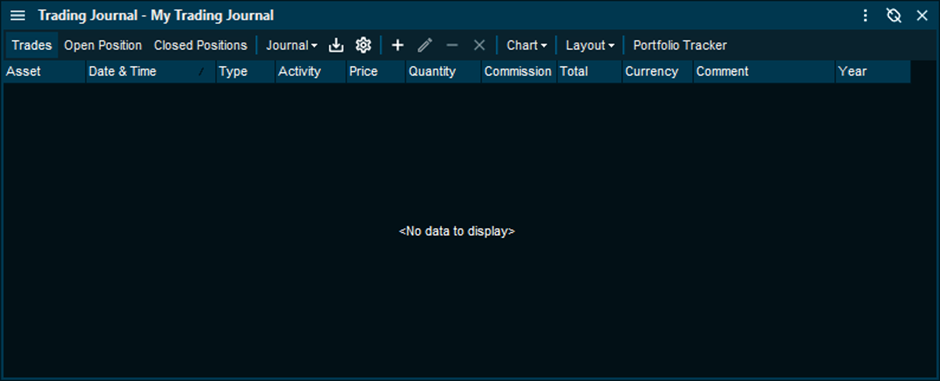
The trading journal displays trades in three different views, Trades, Open Positions and Closed Positions.
Trades Tab: Displays a complete list of all trades recorded to the currently selected trading journal.
Position Views: In the open and closed positions views, individual buy and sell trades are aggregated into groups of trades based on the traded instrument. A position is considered closed when the total bought and sold volume for an instrument nets to zero.
Edit Position
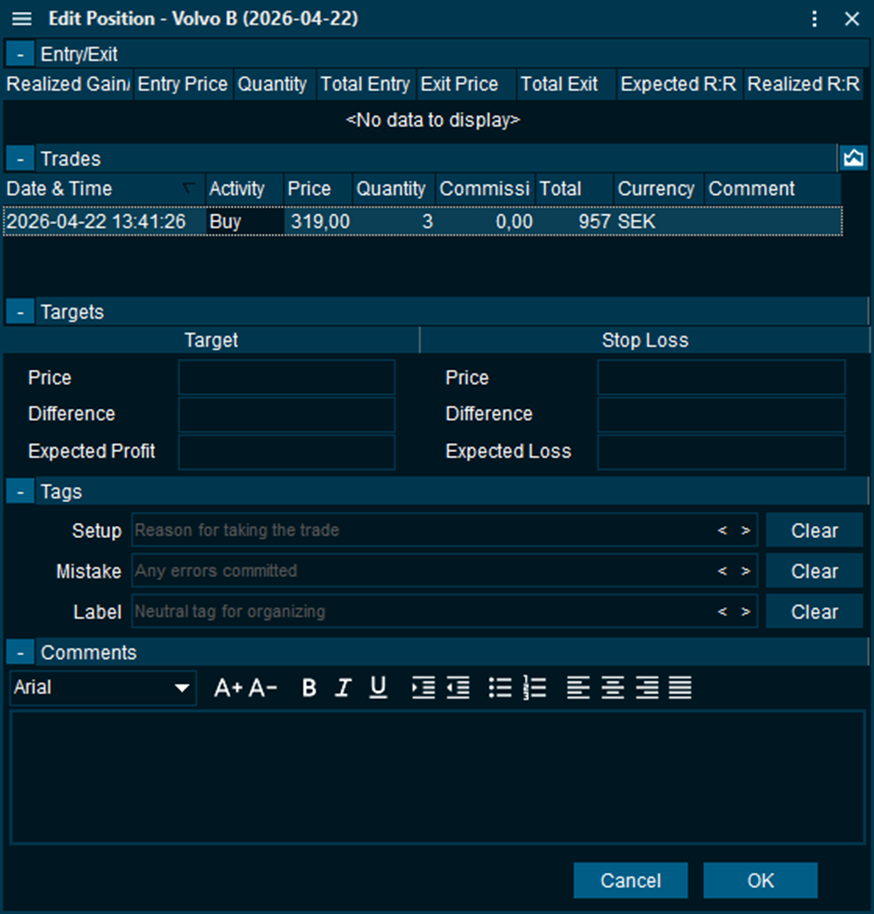
Access the Edit Position window by double-clicking on a position or by selecting the position and clicking on the pen icon in the toolbar.
Enter a Target Price and Stop Loss to automatically calculate the Expected Risk/Return for the position while it is open and the realized risk/return once the position has been closed.
The Tags section allows categorization of a position across three different pre-defined categories:
Setup: The strategy or reason for executing the trade
Mistake: Any errors committed in the execution or strategy employed.
Label: General context, such as market conditions or sector.
At the bottom of the Edit Position window you can enter any formatted free-text comment relating to the position.
Performance Charts
The trading journal provides multiple visualization tools to help identify patterns and trends in your trading performance. The charts are available from the Chart drop-down item in the toolbar.
Price Chart Integration
Visualize trade executions directly on a price chart to review entries and exits in context. Select a position, open the chart dropdown and select Journal Trades to open a price chart of the selected instrument with buy and sell trades.
Performance Aggregation
The trading journal charting allows visualization of realized profit and loss across multiple dimensions. By visualizing your performance you can pinpoint specific times, strategies and behaviors that drive your results.
Histogram Chart: Aggregates profit and loss by time of day, trade duration, entry price, quantity, and total entry cost.
Bar Chart: Categorizes performance by setup and mistake tags, labels, ticker symbols, and timeframes (day of week, month, and year).
Line Chart: Displays cumulative realized profit and loss as an equity curve for the selected currency.
Realized results are displayed per currency and are not converted. For additional contextual information, ticking the position count checkbox displays the total number of positions contributing to each category.
All trading journal visualizations automatically sync and update based on the column filtering applied in the main journal window.
Reviewed Tracking
The Reviewed column is used to track which positions you've reviewed after the fact. Ticking the checkbox for a position automatically marks all underlying trades as reviewed. You can also use column filters to quickly identify positions that are still pending review.
Portfolio Tracker
Open journal positions can be displayed in the Portfolio Tracker by clicking on the Portfolio Tracker button in the Trading Journal window toolbar. Position volumes are automatically synchronized between the trading window, trading journal and portfolio tracker across all windows.