
Charting Features
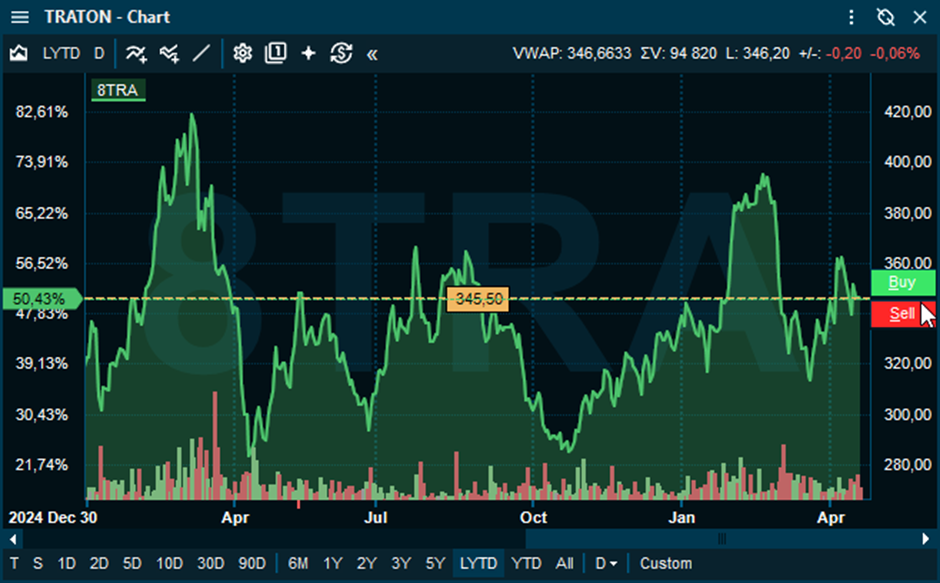
Chart Order Entry
Manage and execute your orders directly within the chart window. This functionality allows for immediate market interaction by placing and modifying orders directly on the price axis.
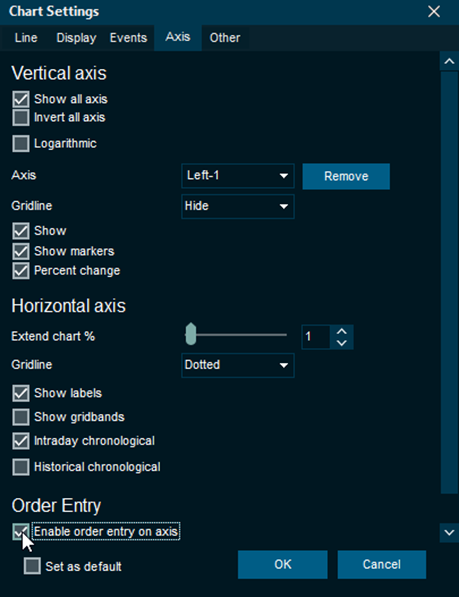
Enabling Order Entry
Chart order Entry is enabled or disabled on a per-chart basis. To enable the functionality:
Open Chart Settings.
Navigate to the Axis tab.
Select the Enable order entry on axis checkbox.
Placing an Order with Chart Order Entry
Once enabled, orders can be created and modified directly from the chart window.
Create an order: Click anywhere on the price axis to place a horizontal price line.
Adjust the price: Click and drag the price line up or down in the chart.
Execute: Press the buy or sell buttons on axis to open the order entry window with your price pre-filled.
Trading Activity Study
Orders and trades can be displayed directly in the chart. Add the Trading Activity study to see your active orders and historical trades directly in the chart.
Modify active orders: Click any order indicator in the chart to open the modification window instantly.
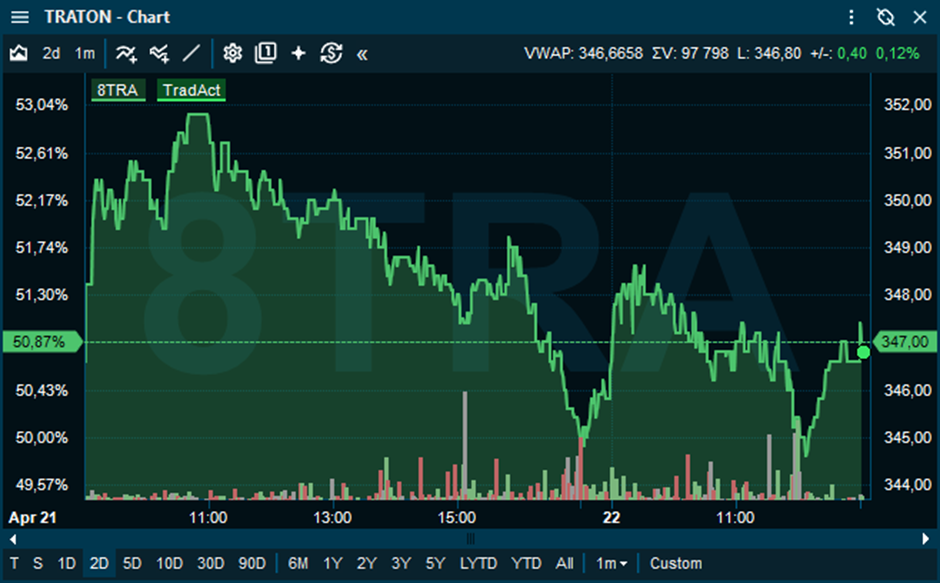
Intraday chart with a buy order visible
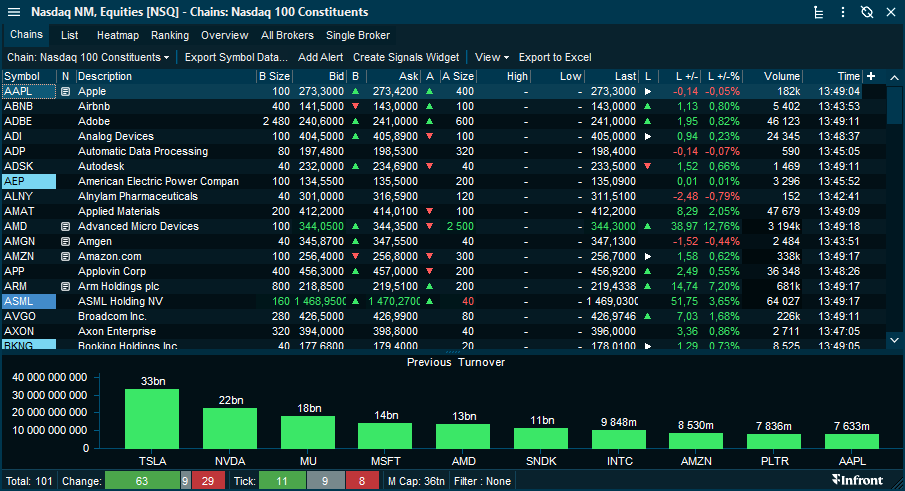
Bar Chart in the Chains tab
The Chains tab in the Market and Watch list windows now supports a ranked bar chart. This chart displays a set number of top and bottom instruments based on the selected column field.
How to Add the Chains Chart
The Chains Bar Chart is turned on by default for new Market and Watch list windows. For existing workspaces and desktops it is not turned on.
Turn it on by selecting the Show barchart item in the View dropdown.
The following section describes how the bar chart can be configured.
Toolbar: Use the View dropdown menu in the Chains tab to adjust the visibility of the bar chart, the number of instruments or fields used for the chart comparison.
Coloring: The colors of the bars will follow the color scheme from Color and Font Setup, with the following definitions: “Positive change”, “Negative change” and “Unchanged”
Default Visibility: The bar chart is visible by default when opening a new market window. For windows saved within a workspace, the chart is hidden by default and must be enabled manually. The functionality can be enabled or disabled in the User Interface, General section of the Advanced Settings.
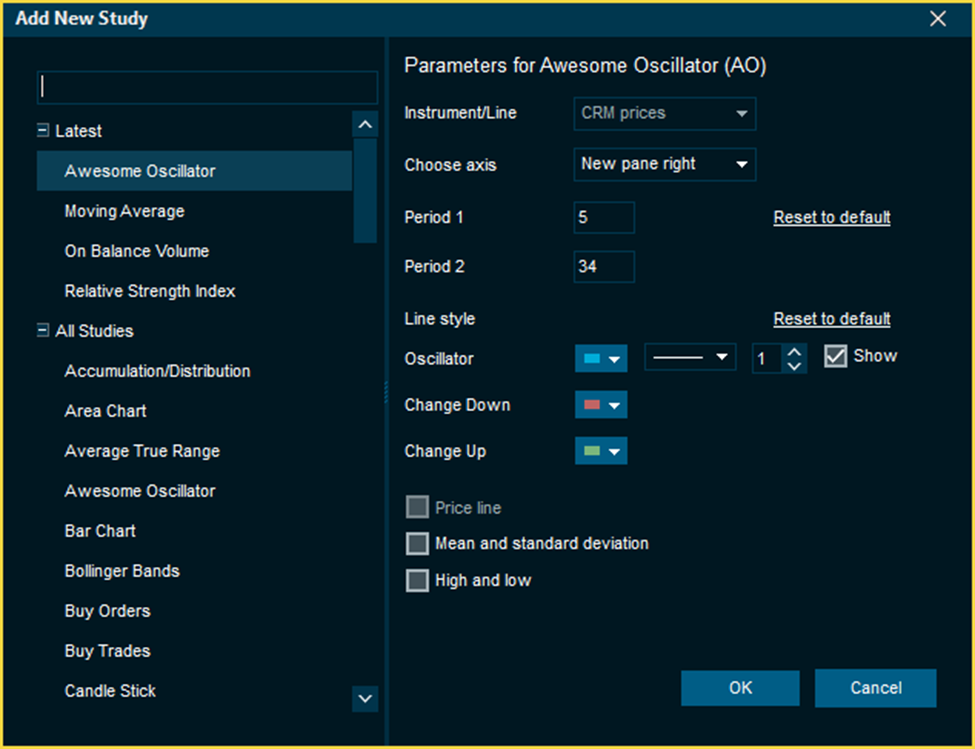
Awesome Oscillator
The Awesome Oscillator (AO) is an indicator used to measure market momentum. AO calculates the difference between two simple moving averages of selected periods, where the default periods are 5 and 34. The simple moving averages that are used are not calculated using closing price but rather each bar's midpoints. AO is generally used to affirm trends or to anticipate possible reversals.
How to Add the Indicator
In the chart toolbar, click the Add study button.
Search for AO or select Awesome Oscillator from the list.
Configure the following parameters in the dialog:
Short/Long Periods: Adjust the lookback lengths for the moving averages (default is 5 and 34).
Visuals: Customize the colors for rising and falling histogram bars.
Click Ok to apply the study to the chart.
Interpretation and Usage
Because of its nature as an oscillator, the Awesome Oscillator is designed to have values that fluctuate above and below a Zero Line. The generated values are plotted as a histogram of red and green bars.
Green Bar: The value is higher than the previous bar.
Red Bar: The value is lower than the previous bar.
When AO's values are above the Zero Line, this indicates that the short-term period is trending higher than the long-term period. When AO's values are below the Zero Line, the short-term period is trending lower than the long-term period. This information can be used for a variety of signals.
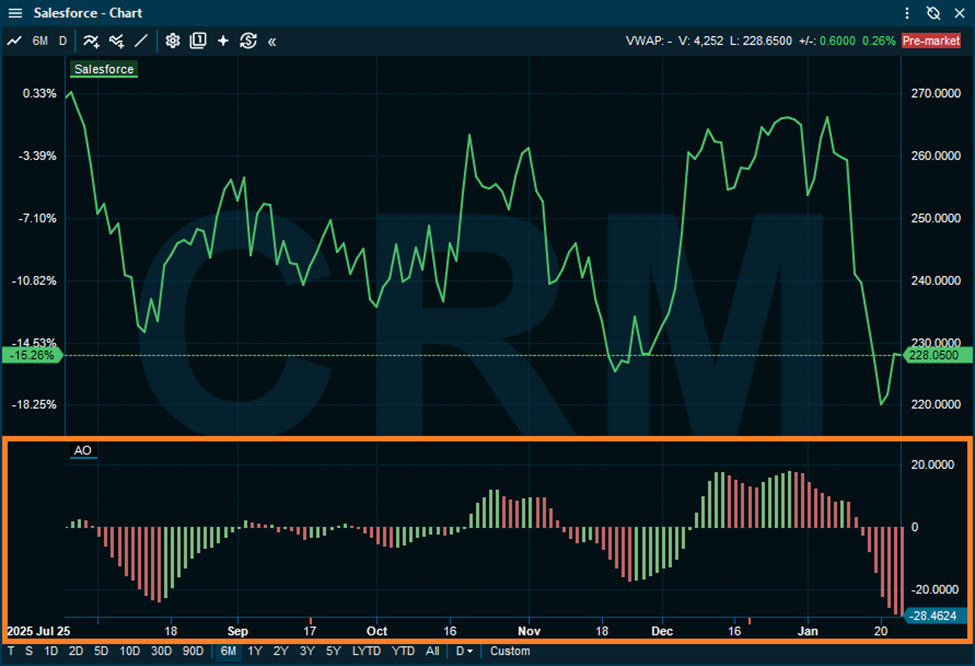
The most straightforward, basic signal generated by the AO is the Zero Line Cross. This is simply when the AO value crosses above or below the Zero Line. This indicates a change in momentum.
Bullish Signal: A cross above the Zero Line indicates that short-term momentum is rising faster than long-term momentum, which may present a buying opportunity.
Bearish Signal: A cross below the Zero Line indicates that short-term momentum is falling faster than long-term momentum, which may present a selling opportunity.
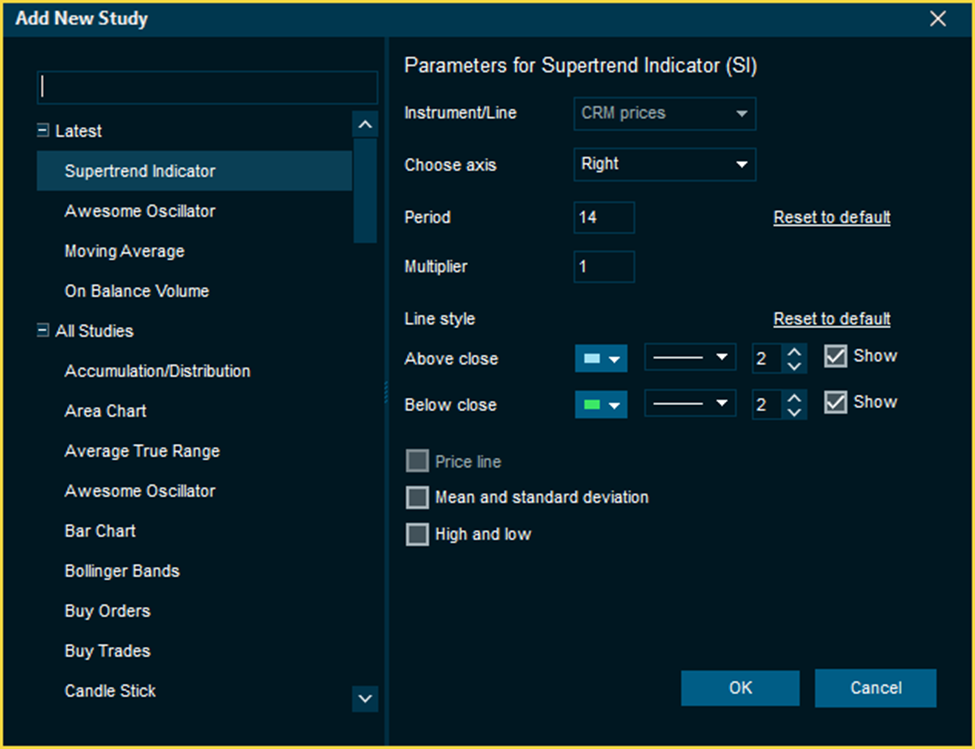
Supertrend Indicator
Supertrend Indicator (SI) is a trend-following indicator based on Average True Range. The calculation of its single line combines trend detection and volatility. It can be used to detect changes in trend direction and to position stops.
How to Add the Indicator
In the chart toolbar, click the Add study button.
Search for SI or select Supertrend Indicator from the list.
Configure the following parameters in the dialog:
Period: The lookback length used for the ATR calculation.
Multiplier: The value by which the ATR is multiplied to offset the indicator from the price.
Visuals: Adjust the study colors as preferred.
Click OK to apply the study to the chart.
Interpretation and Usage
SI is a trend-following indicator. It is overlaid on the main price graph and the plots indicate the changes of the price trend over time. A SI can be used with varying periods (daily, weekly, intraday etc.) and on varying instruments (stocks, futures or forex).
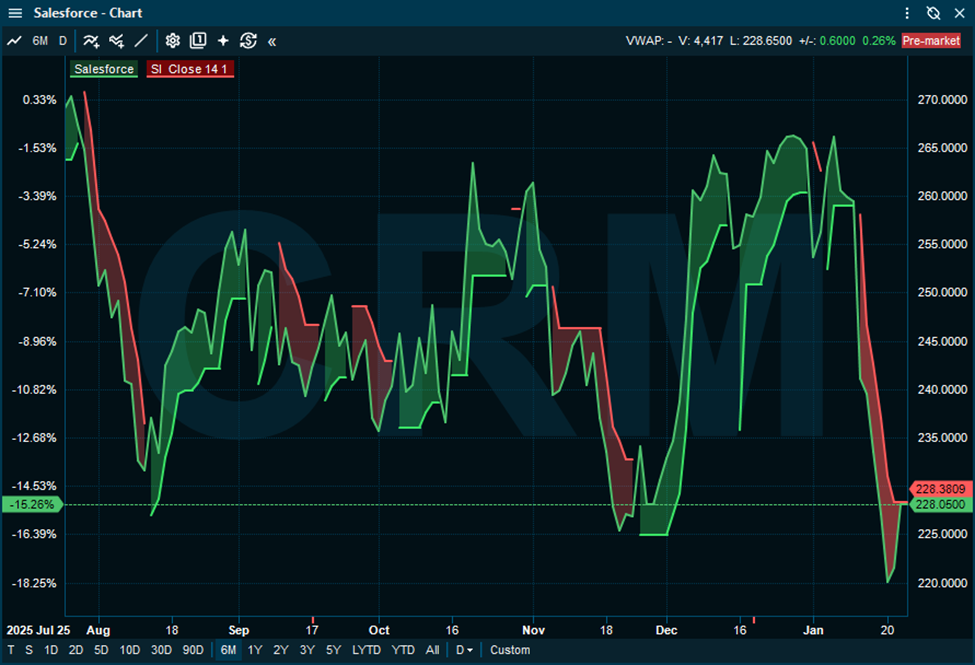
When the price falls below the indicator curve, it turns red and indicates a downtrend. Conversely, when the price rises above the curve, the indicator turns green and indicates an uptrend. After each close above or below SI, a new trend appears.
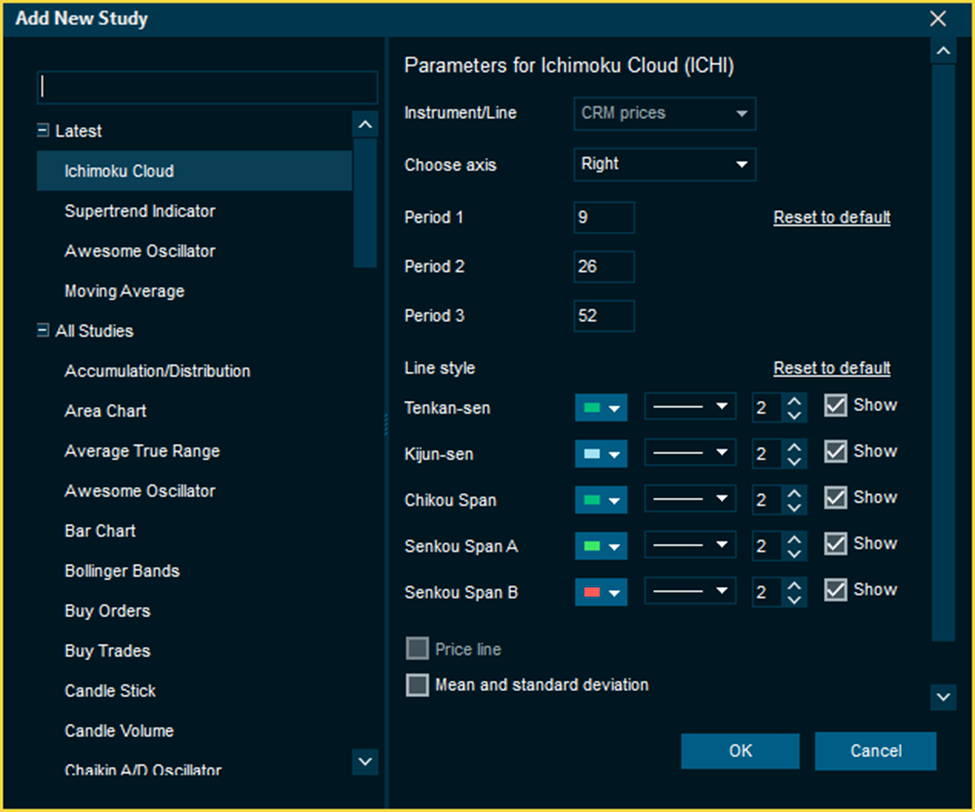
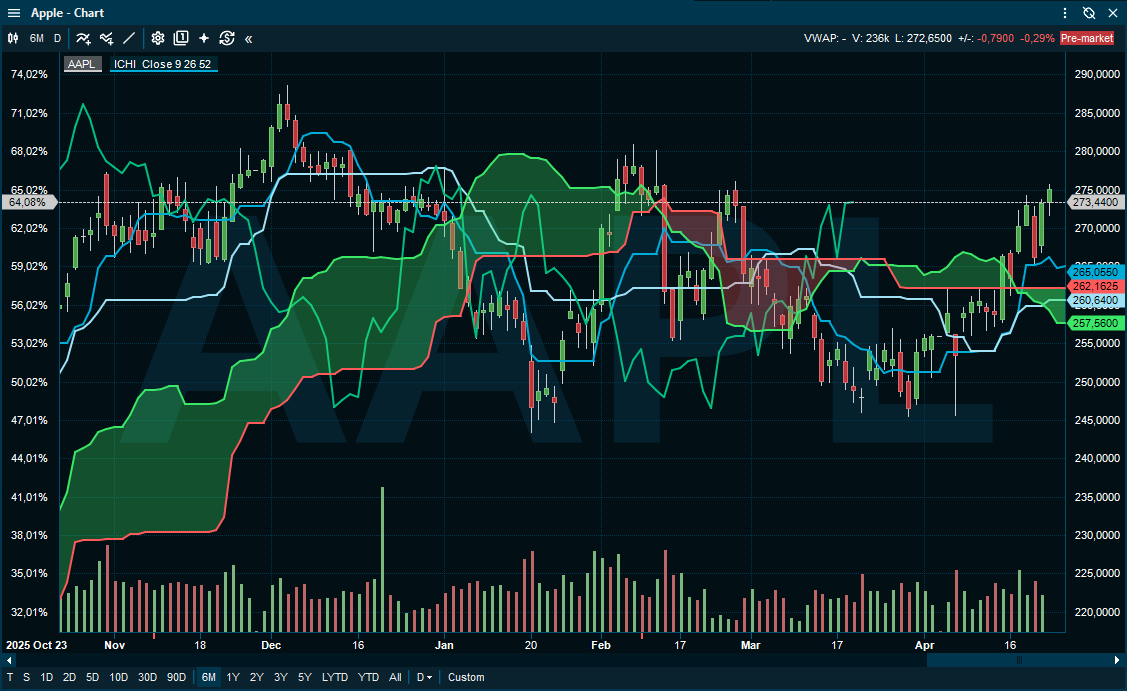
Ichimoku Cloud
The Ichimoku Cloud (ICHI) is a package of multiple technical indicators that signal support, resistance, market trend, and market momentum. It combines multiple calculations to provide a comprehensive view of price action within a single study.
How to Add the Indicator
In the chart toolbar, click the Add study button.
Search for ICHI or select Ichimoku Cloud from the list.
Configure the following parameters in the dialog:
Periods: Adjust the lookback lengths for the three primary calculation periods.
Visuals: Customize the colors for the various output lines and the cloud.
Click OK to apply the study to the chart.
Interpretation and Usage
The Cloud is an integral part of the technical indicator as a whole and helps traders and investors identify the specific calculations made to the chart.
Price above the cloud: When the price is trading above the cloud, the trend is considered bullish.
Price below the cloud: When the price is trading below the cloud, the trend is considered bearish.
These trend signals can strengthen if both the cloud and the price are moving in the same direction. Similarly, the signals can weaken if the cloud is moving in the opposite direction.
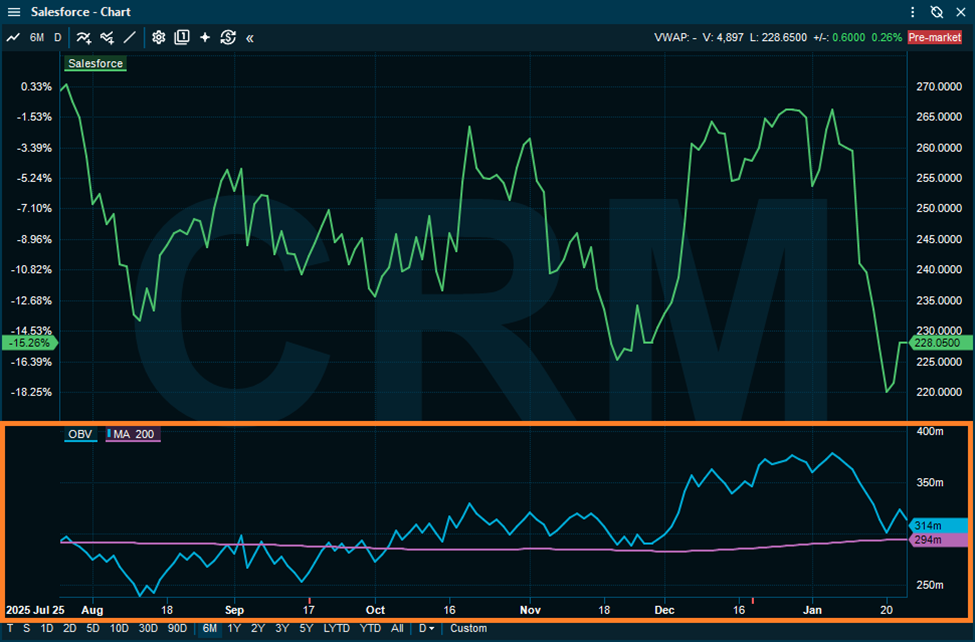
Study on Study
The Study on Study feature allows you to apply a technical indicator to the output of another existing study rather than directly to price data. This enables more advanced analysis, such as smoothing volatile indicator values or identifying trends within specific studies. For instance, adding a moving average study (MA) on top of a On Balance Volume (OBV), can remove noise give insight into longer term trends.
How to Configure a Secondary Study
Ensure a primary study (e.g. On Balance Volume) is already active on your chart.
In the chart toolbar, click the Add study button.
Select the secondary study you wish to apply (e.g. Moving Average).
In the study configuration dialog, locate the Instrument/Line drop-down menu.
Select the existing technical study from the list to use it as the source for the new calculation.
Click OK to add the study to the chart.
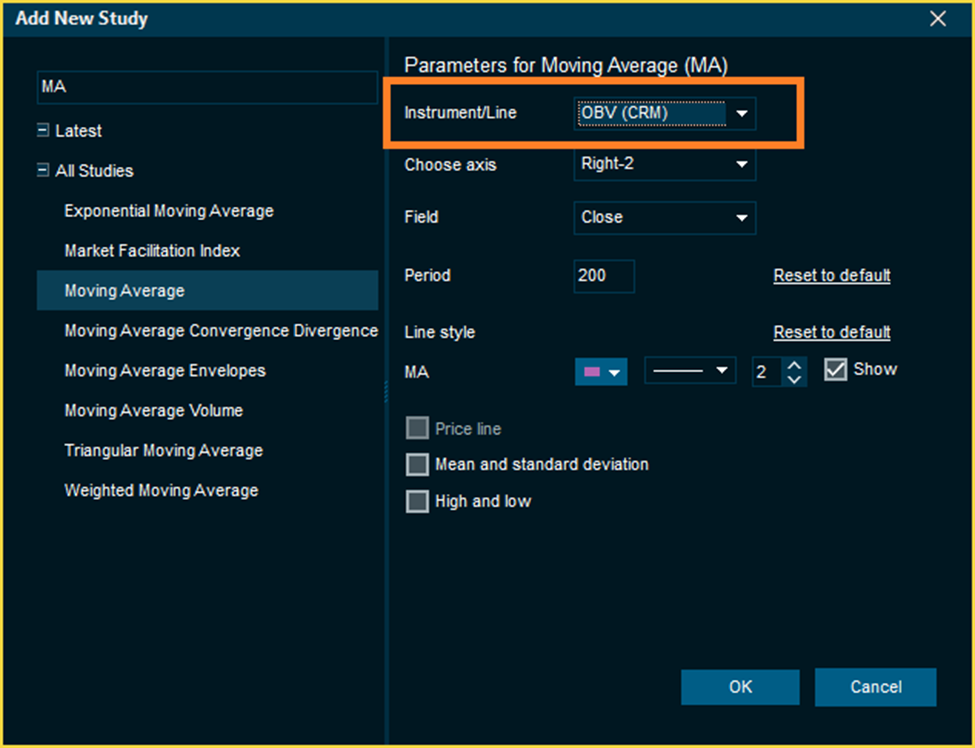
If On Balance Volume (OBV) is already added to your chart, you can select it as the source for a Moving Average (MA). In this configuration, the MA study will calculate moving averages based on the OBV values instead of price, helping to filter out short-term noise and highlight the primary volume trend.
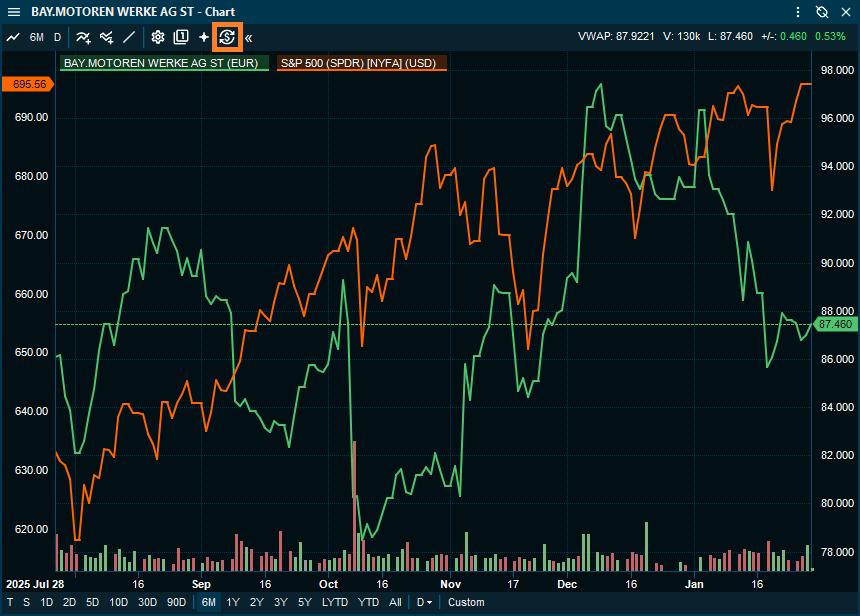
Target Currency support expanded
There are now two levels of target currency configuration in the chart window. The top level configuration is on per window level where all price-graphs are converted to this currency, and second level configuration is on the per graph level.
As a default, the chart does not currency convert anything, and it will show all compare studies in their native currency. For example, given a chart window that has BMW.XET as the primary instrument and S&P 500 as a compare line on the opposite axis, they are shown in their native currencies EUR and USD.
How to Configure the Currency Settings
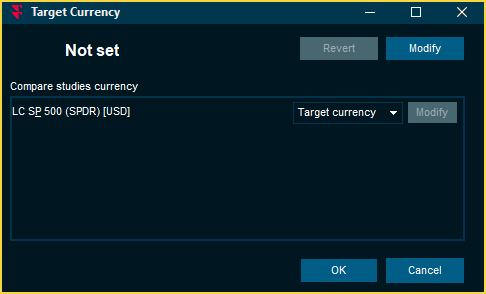
In the chart toolbar, click the Set target currency button to open the configuration dialog.
Choose between Window Level or Per-Graph Level settings:
Window Level: Click Modify at the top right of the dialog to set a global currency. This converts all price-based indicators and comparison studies in the window to the selected currency.
Per-Graph Level: Use the drop-down menu next to a specific comparison study to manage its individual conversion.
Comparison Study Options
When managing individual comparison studies, you can select from three conversion modes:
Local currency: the comparing instruments' native currency will always be kept
Target currency: the compare study will always currency convert to the chart window's target currency
Override: set a currency conversion that only applies to this compare study
In this example, change the compare study drop-down from “Target currency” to “Override”. Then click on the “Modify” next to the drop-down and select a new currency specific for this study, for example EUR to match the current chart window instrument currency or any other currency for that matter. Notice that the currency conversion for this compare study will not change even if the chart window instrument is changed.

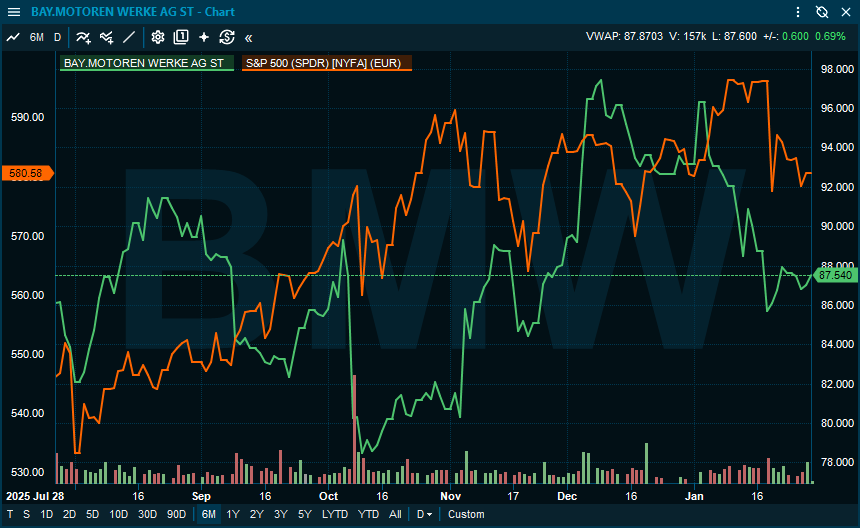
The prices for the compare study are now converted to EUR while the chart window instrument has kept its prices in its native currency. The legend now shows the target currency for the converted compare studies. If all studies in the chart should always be converted to a specific currency it is better to set a target currency on a window level.
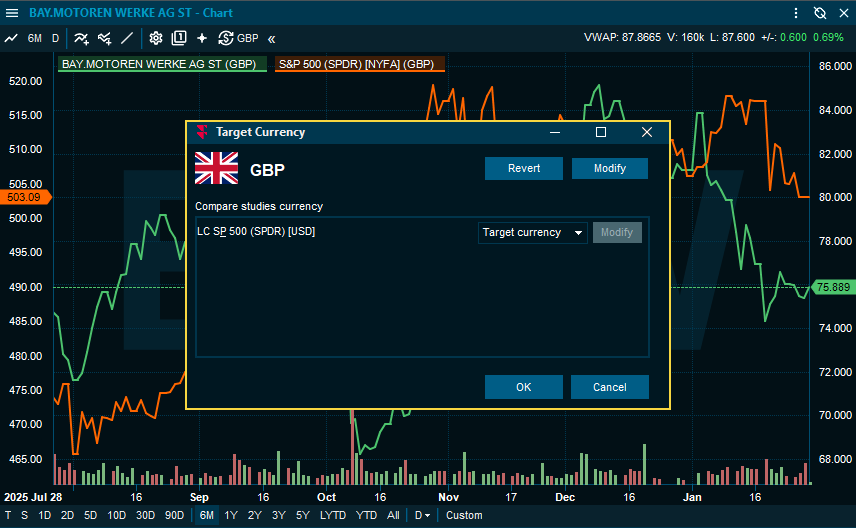
Click on the “Modify” button on the top right of the dialog to set a target currency. All technical studies showing prices and also all compare studies will now be converted to this currency.