How to access
Right-click an instrument > "Charts & Visualizations" > "Return Histogram".
How to use
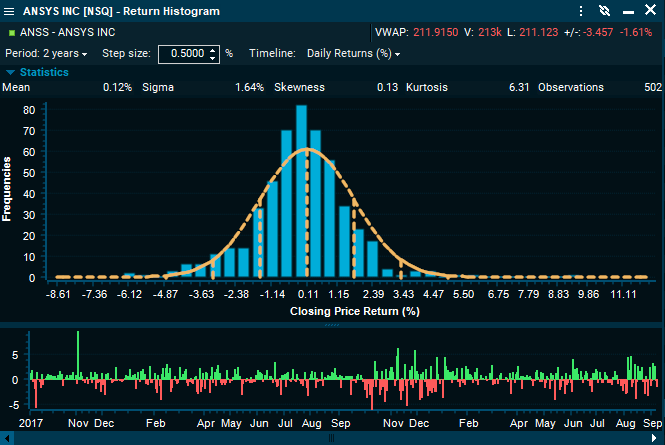
This window displays the empirical distribution of the daily returns for a particular instrument or portfolio.
Period
Time series length. Options: "All", "LYTD" (last year to date), "YTD" (year to date), and 1 to 5 years. You can also specify a custom period by selecting "Custom".
Timeline
Allows the user to select the overview of the series in the lower panel. "Daily returns" displays the log returns in a bar chart, and "History" the actual values of the series.
Statistics bar
On the top of the histogram, the moments of the empirical distribution are displayed.
|
Element |
Description |
|---|---|
|
Mean |
Log daily returns. |
|
Sigma |
Standard deviation from the log return series. |
|
Skewness |
Standardized skewness of the empirical distribution as in Pearson's moment coefficient of skewness. |
|
Kurtosis |
Excess kurtosis of the empirical distribution. |