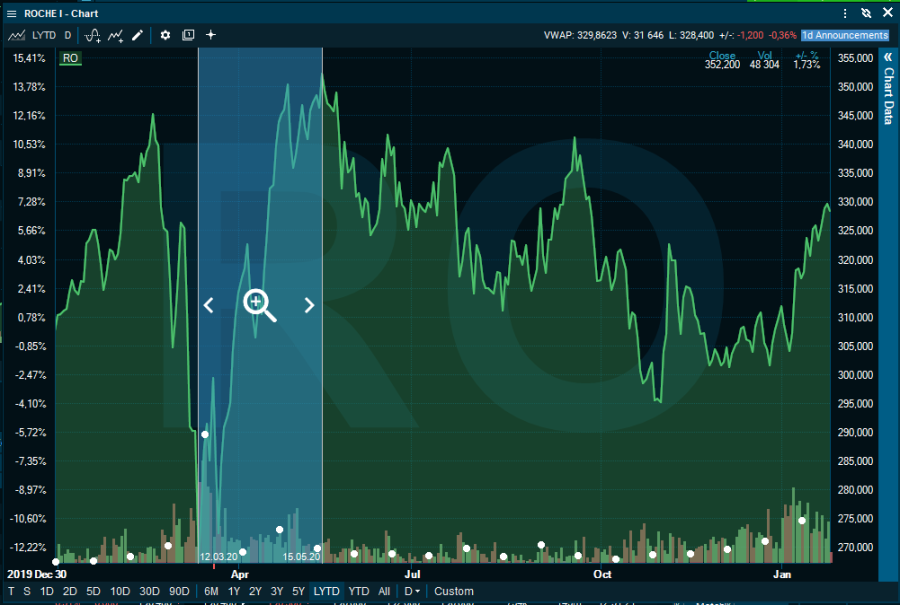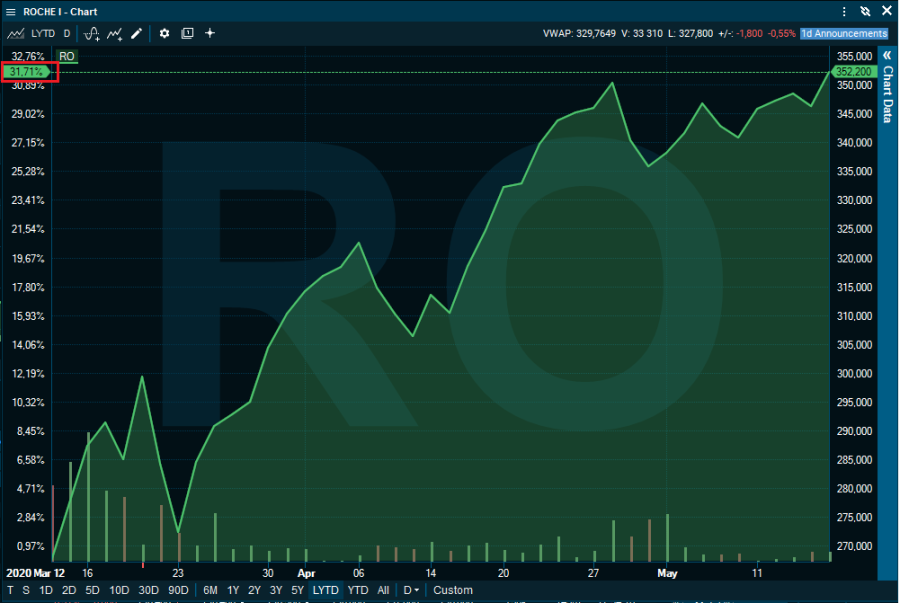
You can quickly zoom in on a particular time period within a chart and the percentage performance on your left axis will adjust, automatically recalculating the return for that period.
For example, to take a closer look at the extreme movements for Roche as of COVID-19 hit and the lowest point at March 12, 2020 to the recovery back to the top at May 2020.
After zooming in on this specific period of your choosing, the percentage performance is re-adjusted on the left axis and we can quickly see the periods return on 31.71%.