
Charting module improvements
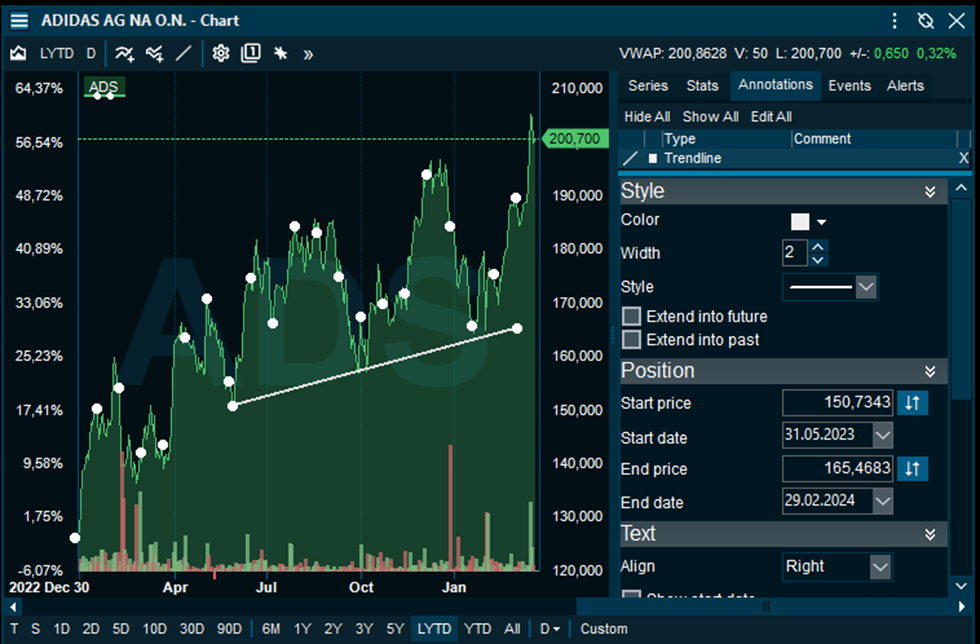
Annotations - persistent configuration
The settings you make on annotations you draw in the chart are now automatically saved as the default settings for any new annotations of the same type that you add later.
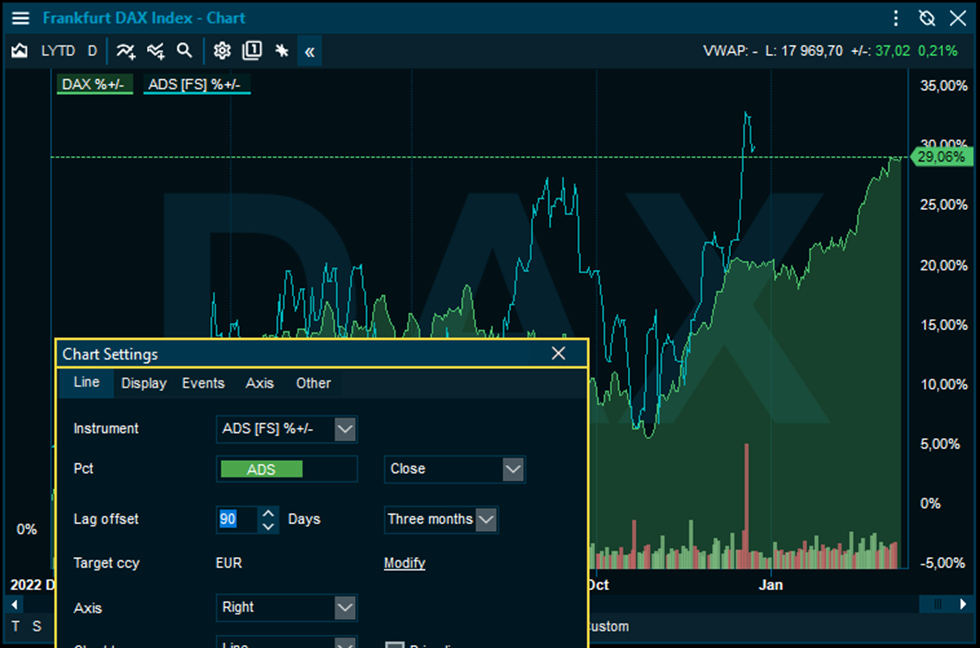
Added support for lagging offsets for compare lines
The compare lines in a chart now have a new Lag offset parameter that can be used to reconcile two instruments that have different update time characteristics, to force the time axis to line up after a certain number of days adjustment.
This is a somewhat contrived example where the ADS compare line is forced to lag three months or 90 days behind the DAX index:
Start-point of 1 day intraday chart
In addition to the choice of including yesterday's close as the first point in the graph, it is now possible to choose if this point should be visual in the chart or only calculated. In the Chart page of Advanced Settings use the checkbox “Calculate only”.
Axis improvements
The left and right chart axis have been improved to work better in cooperation. The general idea is that if one axis shows the nominal prices, the opposite one shows in percent. Earlier there was a choice on the right axis to create a “percent left axis”. This choice has been removed and replaced with a more dynamic option to set “Percent” on either the left or the right axis, where the opposite one will change to nominal.
This logic also applies to axis that are stacked on top of each other. If a technical/compare study is added on an axis below the active one, it is now possible to add a percent axis to the left (or right) and switch between nominal and percent.
Text annotation improvements
When creating a new text annotation, a new dialog will be presented with the most common settings. Clicking on a text annotation will now select it (to be in line with the other annotations behavior) instead of directly edit it. Right-click on a text annotation will now bring up a context menu with the ability to either edit or delete the annotation.