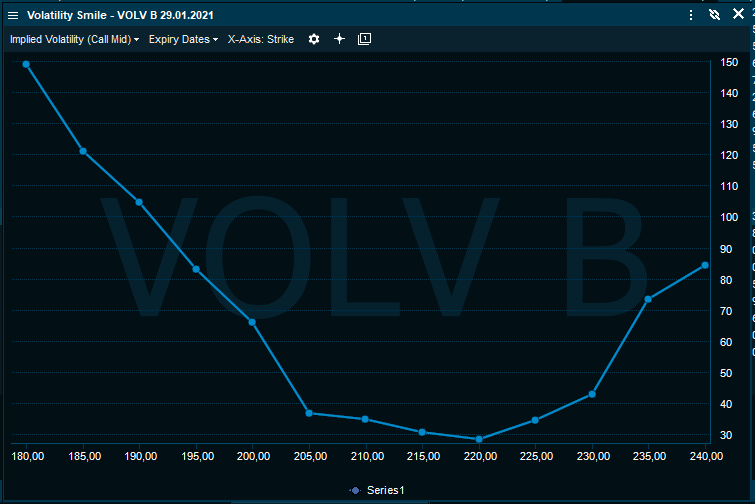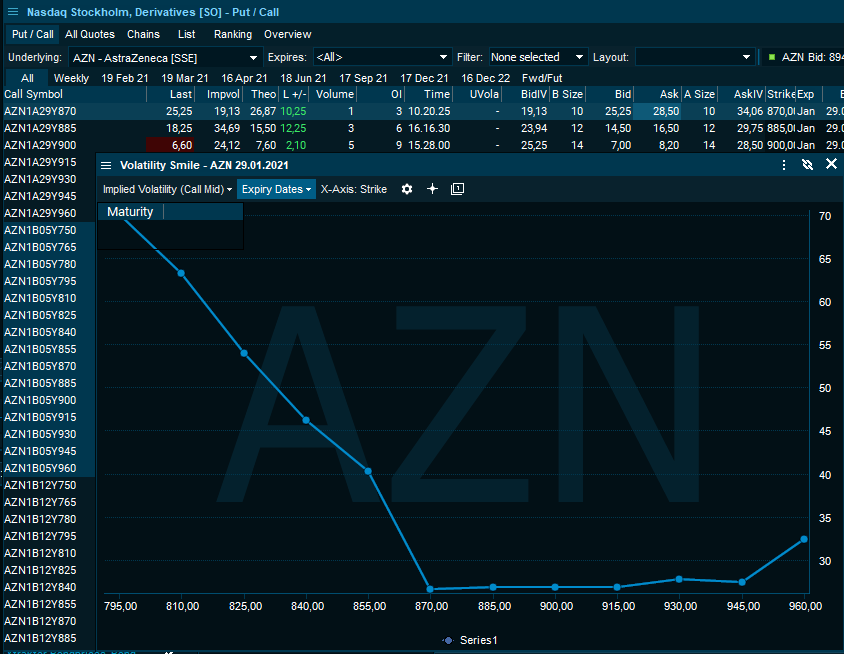
Volatility smile
The volatility smile charts the volatility of an option across strike prices. It visually represents how options with the same underlying and expiry date are valued base on implied volatility across strike prices.
Open an option market, right-click and select "Volatility Smile" under charts and a series of 6 steps below and above of strike prices are selected and is charted to easily see if the typical U shape for your selected strike range and its moneyness (ITM, ATM or OTM) applies or if market perception differs from the traditional pattern.