
User interface
The user interface setup consists of 9 subcategories.
General
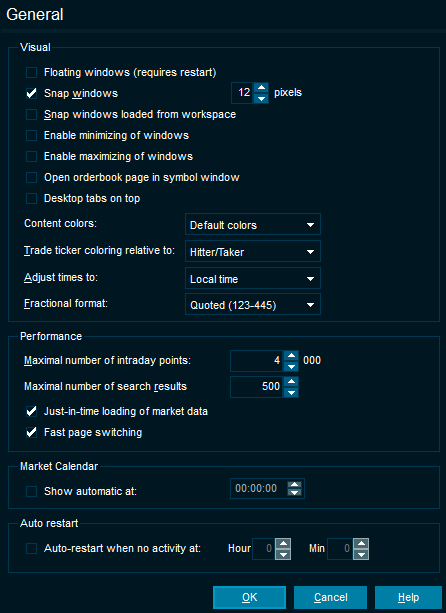
Here, you can configure the following elements:
Element | Description |
|---|---|
Visual | |
Floating windows | Enables the floating mode when selected. |
Snap windows | Every nth pixels: a feature to make it easier to place windows next to each other correctly. |
Snap windows loaded from workspace | Same function as above, but it will snap all the windows together when you load a workspace. |
Enable minimizing of windows | Adds the "Minimize" icon in all windows. |
Open orderbook page in symbol window | Opens the "Orderbook" (OB) tab by default instead of the "Overview" tab when opening an "Overview" window (<CTRL>+<Q>). |
Content colors | Allows you to change between color themes. |
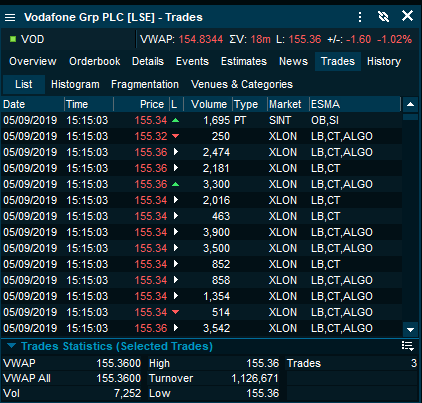
Trade ticker coloring relative to | Changes the trades list (time and sales) colors for up and down. The trades below are colored red because the prices are lower than the previous close in the example below.
|
Adjust time to | Local / Feed / GMT / Unadjusted |
Performance | |
Maximal number of intraday points | The maximum number of prices or last values to be displayed in a chart. |
Maximal number of search results | Limits the number of search results. |
Just-in-time loading of market data | If you have several desktops open, the terminal will not load market data on them until you view them. |
Market Calendar | |
Show automatic at | Set a time at which you want the "Market Calendar" window to open. |
Auto-restart when no activity at | If there is no user activity (no mouse or keyboard activity detected in the last 4 minutes), then the Infront Professional Terminal automatically restarts, saving and restoring the current workspace at the time you specified, for example at 20:00 (8 P.M.). |
Grids
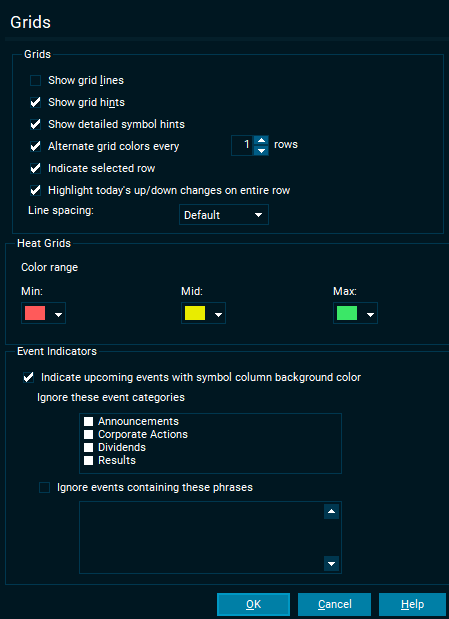
Select the relevant checkboxes to display grid lines, grid hints and alternate grid colors on rows or mark selected row.
Element | Description |
|---|---|
Grids | |
Show grid lines | Displays grid lines in tables to clearly separate rows and columns. |
Show grid hints | Shows hints with more information for certain data fields you hover over. |
Show detailed symbol hints | Shows an informative hint with a chart for the symbol you hover over. |
Alternate grid colors every x rows | Applies different colors to alternate rows. |
Indicate selected row | Marks the selected row. |
Highlight today's up/down on entire row | Sets the font color for the entire row to the corresponding up/down color and not just the +/- columns which is the default. |
Line spacing | Refers to the space taken by each row in a market window, news window, custom lists and orderbooks. You can increase the spacing to improve readability or decrease to save space. |
Charts
Element | Description |
|---|---|
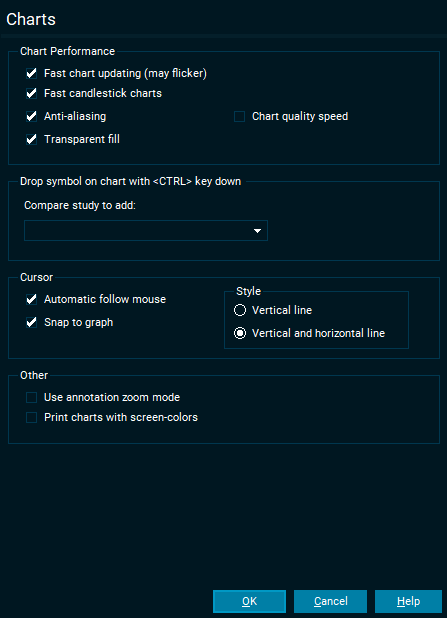
Chart performance | |
Fast chart updating | When there are too many data points in the chart relative to the space available, some periods in the chart may be drawn on top of neighboring periods. This setting provides a performance improvement when such is the case. |
Fast candlestick charts | Adjusts the resolution of the chart (1, 10, 15 minutes intervals) so that all the data points for the time period selected can fit in the chart window. Turn on for a performance improvement. |
Anti-aliasing | Smoothing of jagged appearance of charts. Turn off for a performance improvement. |
Transparent fill | Area charts are partially transparent. Turn off for a performance improvement. |
Drop symbol on chart with <CTRL> key down | This setting controls what type of compare chart you get if you hold down the <CTRL> key when dragging and dropping a symbol into the chart. |
Cursor | |
Automatic follow mouse | When moving your mouse across the chart, a visual grid cursor will update the date/time and price on the x and y axis. |
Snap to graph | Combined with "automatic follow mouse", switch this setting off to only see a visual grid cursor for date/time on the x axis. Example below with this feature switched off. |
Style | Choose between a "vertical and horizontal" cursor (crosshair) or only a "vertical" cursor. |
Other | |
Use annotation zoom | If switched on, it is no longer necessary to hold down <CTRL> to draw annotations in charts. |
Print charts with screen-colors | By default, the charts will optimize ink usage by printing with a white background. Switch this setting off if you wish to print with the same colors as the screen is showing. |
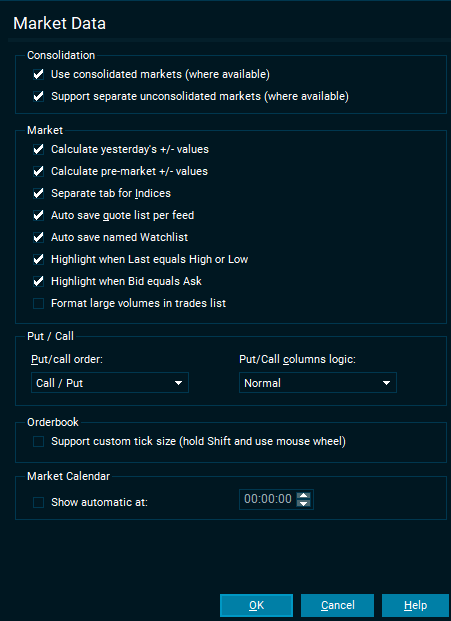
Market Data
| Element | Description |
|---|---|
| Consolidation | |
| Use consolidated markets (where available) | Automatically switches on consolidated data for users with access to alternative marketplaces such as MTFs. |
| Support separate unconsolidated markets (where available) | Instead of consolidating market data to one market place, switching this option on will give access to the unconsolidated feeds separately. |
| Market | |
| Calculate yesterday's +/- values | Show yesterday's +/- change while the market is closed. |
| Calculate pre-market +/- values | When pre-trade Bid and Ask values match, this option calculates change (+/- and +/-%) values in the pre-market period when there were no trades (and no last price). This allows you to see where the market will open for each symbol that has pre-market orderbooks. |
| Separate tab for Indices in Market windows | Move all indices from the "All Quotes" tab to a separate tab called "Indices". |
| Auto-save quote list per feed | Automatically save the list you build up on the "List" tab in a market window. |
| Auto-save named Custom Lists | If you have opened a previously saved custom list, any changes you make to it will automatically be saved. |
| Highlight when Last equals High or Low | The last column in a market window or custom list will the change background color if the last price is the same as today's high or low. |
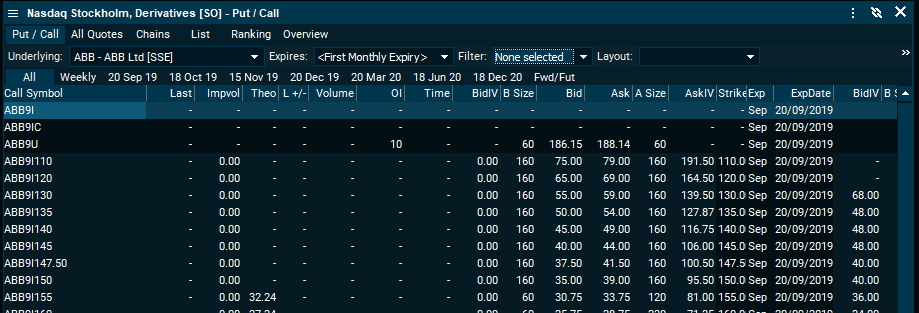
| Put / Call | |
| Enable multiple selection of underlyings | Allows the user to select more than one underlying instrument in the put/call tab for derivatives markets. |
| Put/call order | Determine whether derivatives markets should be shown with calls on the left and puts on the right, or opposite. |
| Put/Call columns logic | Normal mode shows default columns for derivatives market. "Include subtype" will add the subtype column. |
Regional
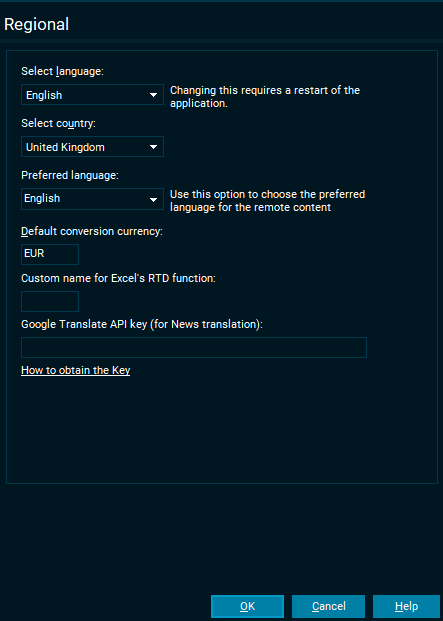
Select language and country
Infront Professional Terminal will try to detect an appropriate default country and language for your Infront Professional Terminal. If you want to change this, you can select a preferred default country and language.
The selected country is shown by default when opening some desktops in desktop builder. It also determines what country is shown at the top of the "Select Market" dialog and the "Select News" dialog.
Default conversion currency
The default currency used by the trading window as a target currency for conversion of your portfolio values.
Browser
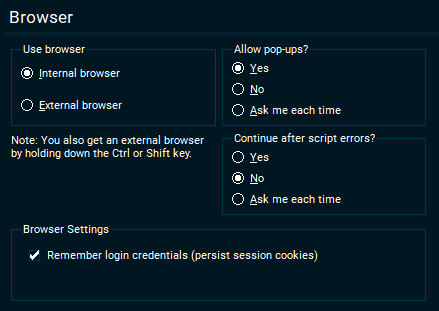
Choose internal or external browser and decide if you want to allow pop-ups or not.
Dialogs
Select the checkbox to restore all warnings and other information dialogs where you have selected "Don't show this message again."
Searching
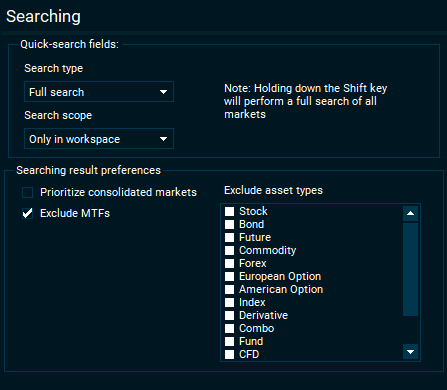
Quick-search fields
| Element | Description |
|---|---|
| Quick-search fields | |
| Search type | Select between "Full search" (ticker and instrument name) and "Ticker" when using quick search inside market windows, custom lists, charts, orderbooks and more. |
| Search scope | Select whether the quick-search should search in:
|
| Searching result preferences | |
| Prioritize consolidated markets | Some users have static consolidated markets from the server. When this is available, the search results can be prioritized to display results from these markets first. |
| Exclude MTFs | Select this checkbox to avoid seeing search results from MTFs such as BATS and Chi-X. |
| Exclude asset types | Removing asset types you never search for can help display results most relevant to you. |
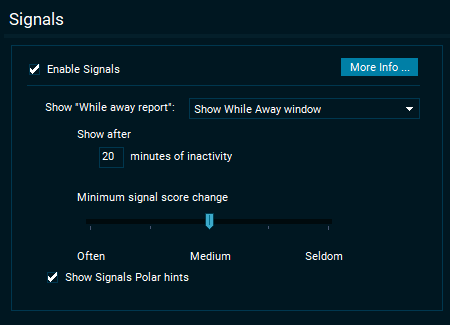
Signals
| Element | Description |
|---|---|
| Enable Signals | For more information, see Signals. |
| Show "While away report" | Infront Professional Terminal may detect interesting movements and events that occurred while you were away from your computer. |
| Show Signals Polar hints | When holding your mouse over a given signal, the terminal will try to display a polar chart. |