
Seasonality Matrix
How to access
Right-click an instrument > "Charts & Visualizations" > "Seasonality Matrix".
How to use
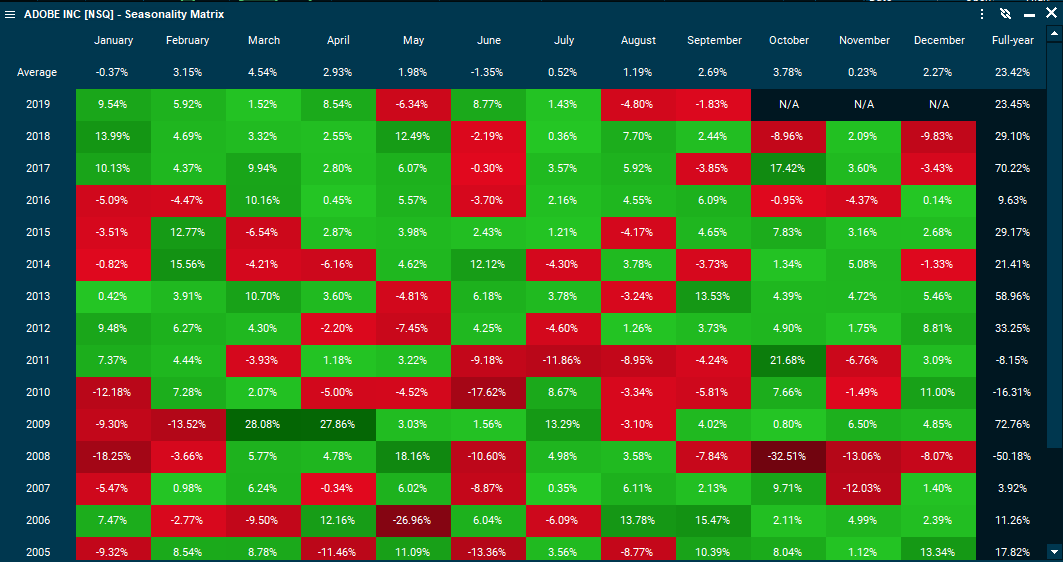
The Seasonality Matrix provides a graphical overview on the previous performance for specific months and years.
Right-click an instrument > "Charts & Visualizations" > "Seasonality Matrix".
The Seasonality Matrix provides a graphical overview on the previous performance for specific months and years.