
Macroeconomic Indicators
The Macroeconomics Indicators window brings completely new coverage to macroeconomics analytics and data discovery. You can analyze a vast array of criteria, from consumer spending and GDP growth, to car manufacturing, weapon sales and unemployment. You can also easily track historical data as well as forecasted data for each and every global data point. With all this data in reach, you need a powerful tool to find and make sense of the information that is relevant to you. The Macroeconomics Indicators window makes it easy to search, filter, sort and analyze data so that you can cut through the noise and identify investment opportunities quickly and easily.
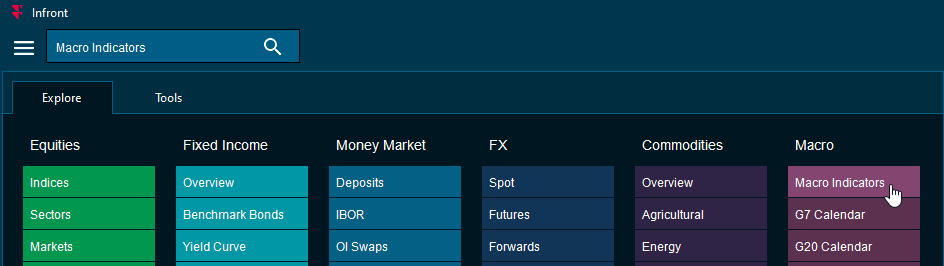
How to open the Macroeconomic Indicators window
Open the main menu, select the "Explore" tab, and click on the “Macro Indicators” button in the “Macro” column.
How to use the Macroeconomic Indicators window
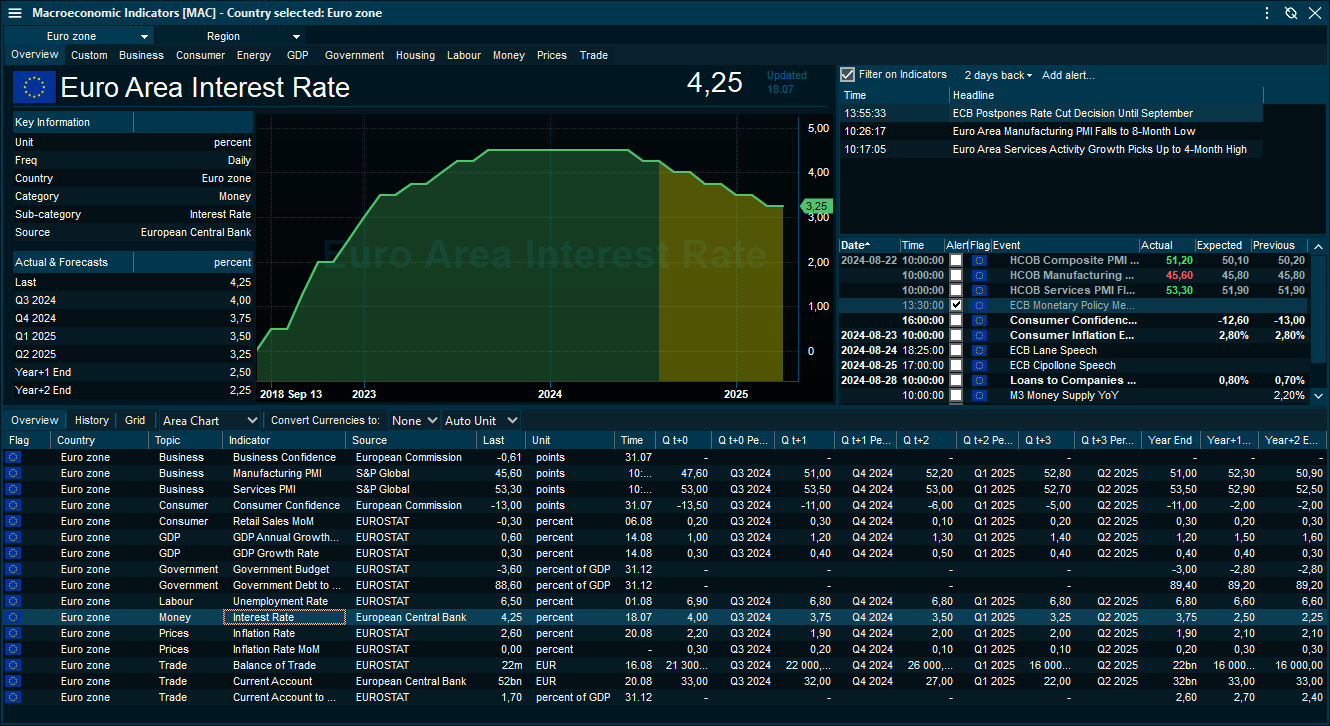
The Macroeconomic Indicators window offers a comprehensive solution for exploring, browsing and analyzing the over 13 000 macroeconomic indicators available in the Infront Professional Terminal. The Macroeconomic indicators window uses a data structure of country, topic and indicator type, to identify and present comparable metrics between peer countries.
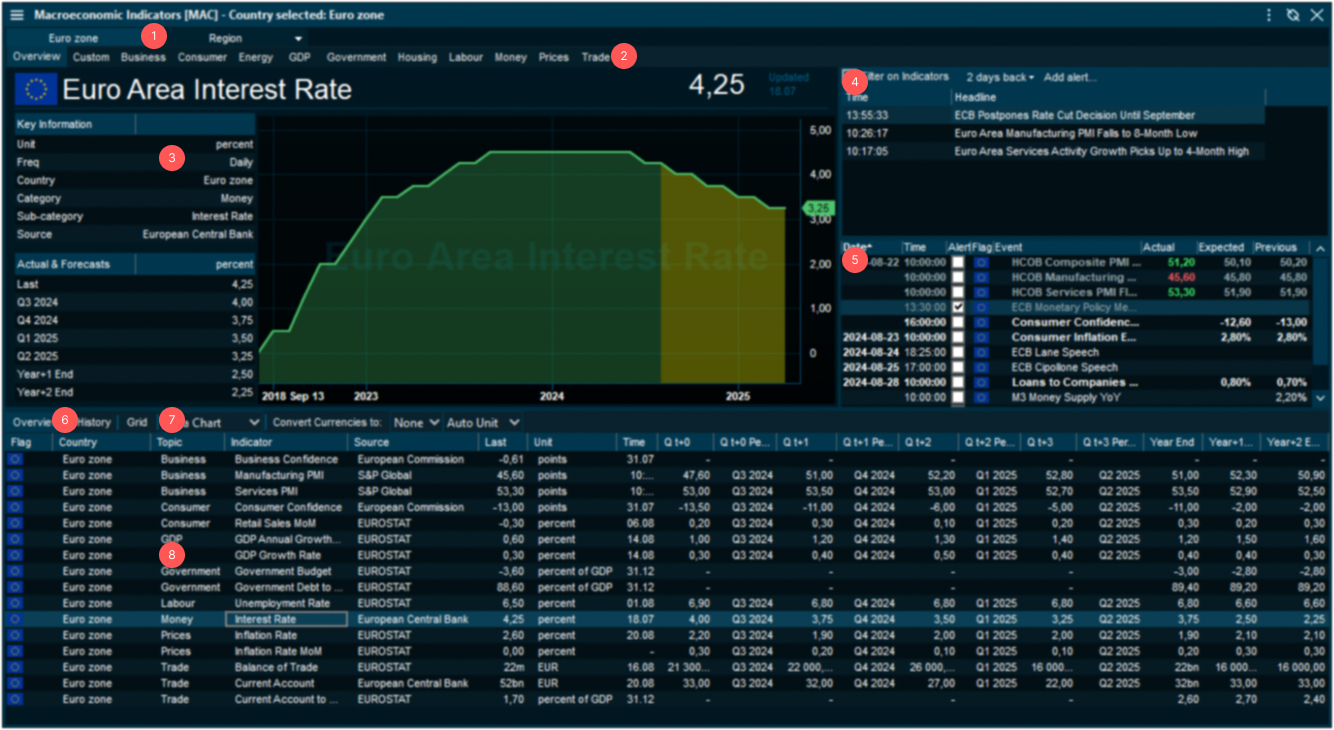
Country and Region Selection - Macroeconomic indicators can be browsed either as a single country or by groups of countries, called regions. Countries and regions are selected with a dropdown menu in the upper left-hand corner of the Macroeconomic Indicators window.
Category Selection - View categories of macroeconomic indicators by clicking on the topic selection menu near the top of the window. The Overview tab includes a combination of important macroeconomic indicators from different categories, while the Custom tab allows manual selection of any macroeconomic indicators related to the selected country.
Indicator Overview - Each indicator comes with a detailed overview window where historical values are combined with forecasted values both in a chart and as a table. Historic values are displayed in green and forecast values are displayed in yellow. The currently displayed chart can be opened in a separate chart window by clicking in the chart.
News - Macroeconomic news are displayed within the news widget. The window can be set to either include news for all indicators or limited to news related to visible symbols in the indicator list by checking the Filter on Indicators alternative.
Events - When the Overview tab is selected. a calendar with today’s and upcoming macroeconomic events related to the selected countries is visible. The calendar displays the actual, expected and previous values for the event. Revisions of previous values are indicated with an asterisk. Checking the alert in the calendar box will give an alert notification within the terminal prior to the event occurring.
List Layout - The indicator list can be displayed in three different layouts
Overview, which displays the latest reported value and the forecast values for the coming four quarters.
History, in which historic data can be loaded and viewed in a table for easier comparison between peer indicators.
Grid, which shows the most important macroeconomic indicators and their last reported values in a heatmap.
Chart Selection - The chart type visible in the Indicator Overview can be changed from the chart selection dropdown. Single indicators can be displayed in bar charts or a line charts, while groups of indicators can be displayed in bubble charts or line comparison charts.
Indicator List - Contents of the indicator list depends on the selected countries and topic category. Double-clicking on a macroeconomic indicator in the list will update the Indicator Overview. In region view, comparison charts can be initiated by clicking the chart comparison button.
Comparing macroeconomic indicators
When a region is selected, it is possible to display two types of comparison charts.
Line Comparison Chart - is initiated by selecting Compare Chart in the chart selection dropdown menu, or by clicking on the chart comparison button in the indicator header in the indicator list.
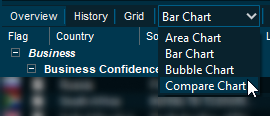
Select compare chart from the chart selection menu
Click on the chart comparison button in the indicator header.
When a comparison chart is active, indicators from specific countries can be included or excluded from the comparison chart by checking the box that appears in the indicator list.
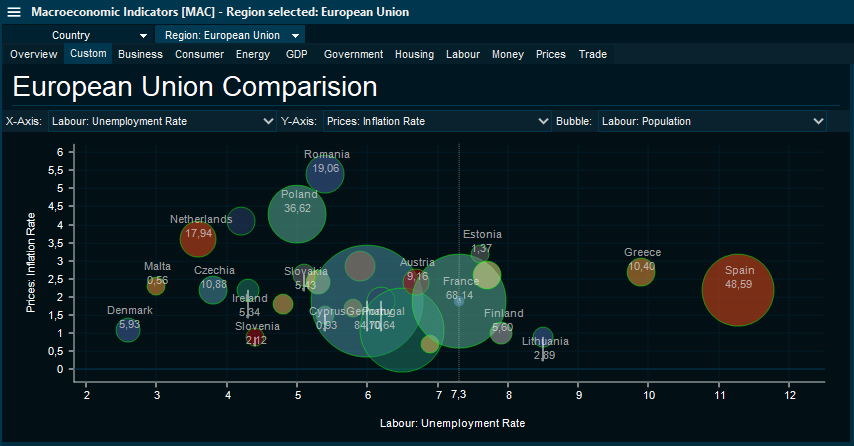
Bubble Chart - is initiated by selecting Bubble Chart in the chart selection dropdown menu. Indicators from the indicator list are assigned to axes with the dropdown menus at the top of the chart. The bubble chart can be opened in the Custom tab to combine indicators from different topic categories.
Customizing Regions
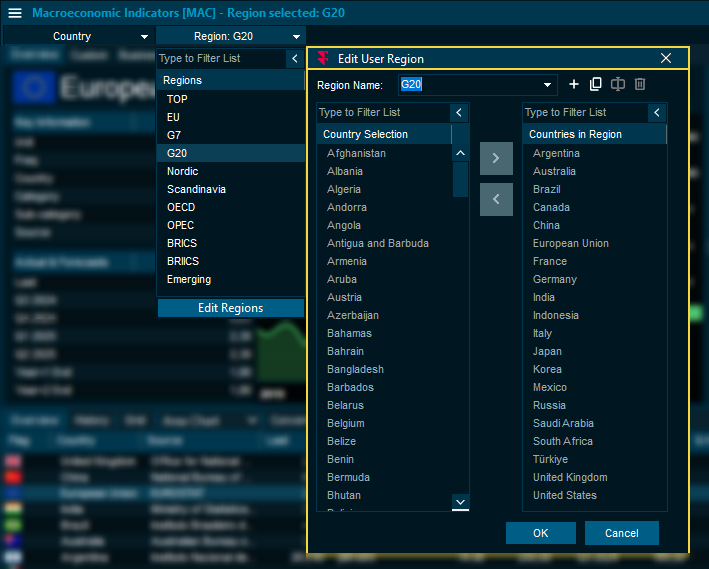
The Macroeconomic Indicators window comes with a number of premade regions. In addition to the default regions, it is also possible to create custom list of countries.
To edit a region, press the region button, and select the Edit Region button at the bottom of the dropdown menu.
Use the following buttons to create and manage custom regions.
![]() Create a new custom region
Create a new custom region
![]() Copy the constituent countries from the currently selected region
Copy the constituent countries from the currently selected region
![]() Rename the selected custom region
Rename the selected custom region
![]() Delete the selected custom region
Delete the selected custom region
The custom region will only include countries listed in the right column. Countries can be moved from the right or left column by double-clicking, or by using the buttons between the two columns.
Premade regions cannot be renamed or deleted.