
Historic statistics on trading venues
Building on the "All Listings" feature introduced last year and Infront's powerful trading venue network, we now feature this data in historic time series. In various visualisations, this enables you to see how trading volumes fluctuate across trading venues over time.
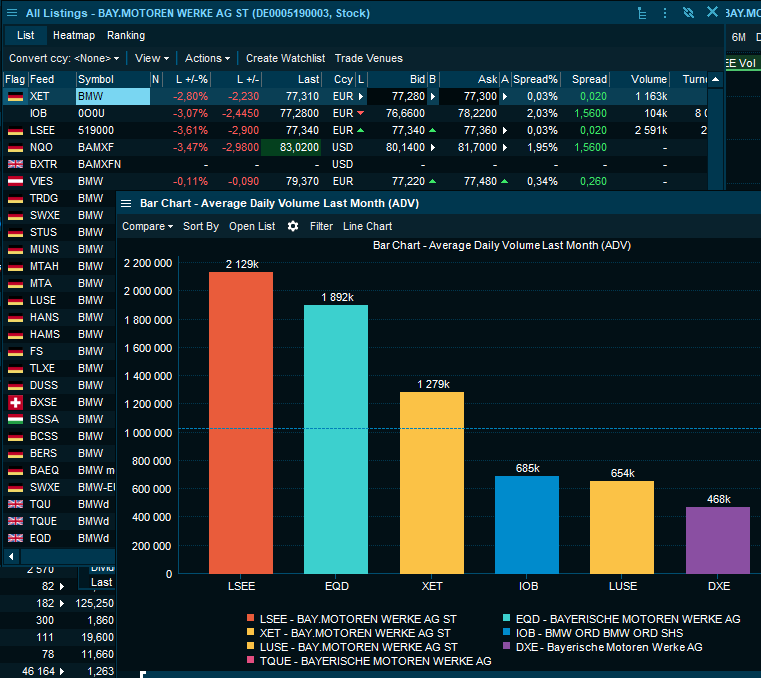
In the example below, Average Daily Volume (ADV) last month is presented in a bar chart where we can see that the majority of trade flow on the BMW stock is in fact not on its primary market Xetra, but London SE followed by Equiduct.
Further examining this data, we use daily volumes to capture day-to-day changes over time presented in a line chart:
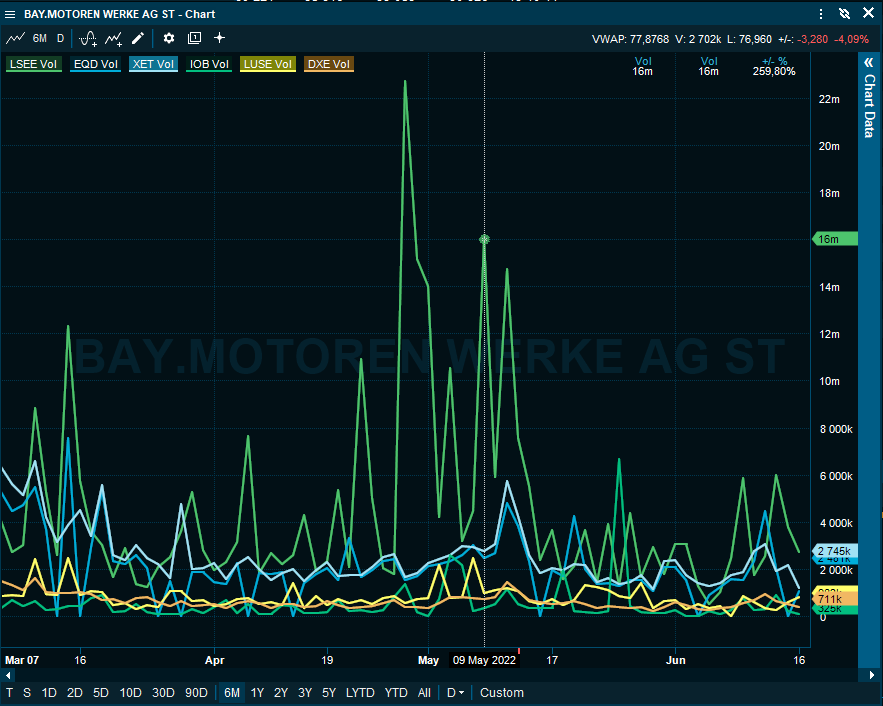
It's evident that the spike in total volumes in May is executed on LSE, however this is not the case in a period in March where Xetra and Equiduct executed the highest volumes.
For traders, market surveillance, investor relations and CFOs, these patterns, as well as deviations from them, can be valuable findings that are now easier to discover.