Correlation Matrix
How to open
Select multiple instruments in a market window or a watchlist > right-click > "Charts & Visualizations" > "Correlation Matrix".
Description
The "Correlation Matrix" window displays the cross correlation among multiple instruments.
Element | Description |
|---|---|
Time Frame | Time series length. You can select from the following options:
|
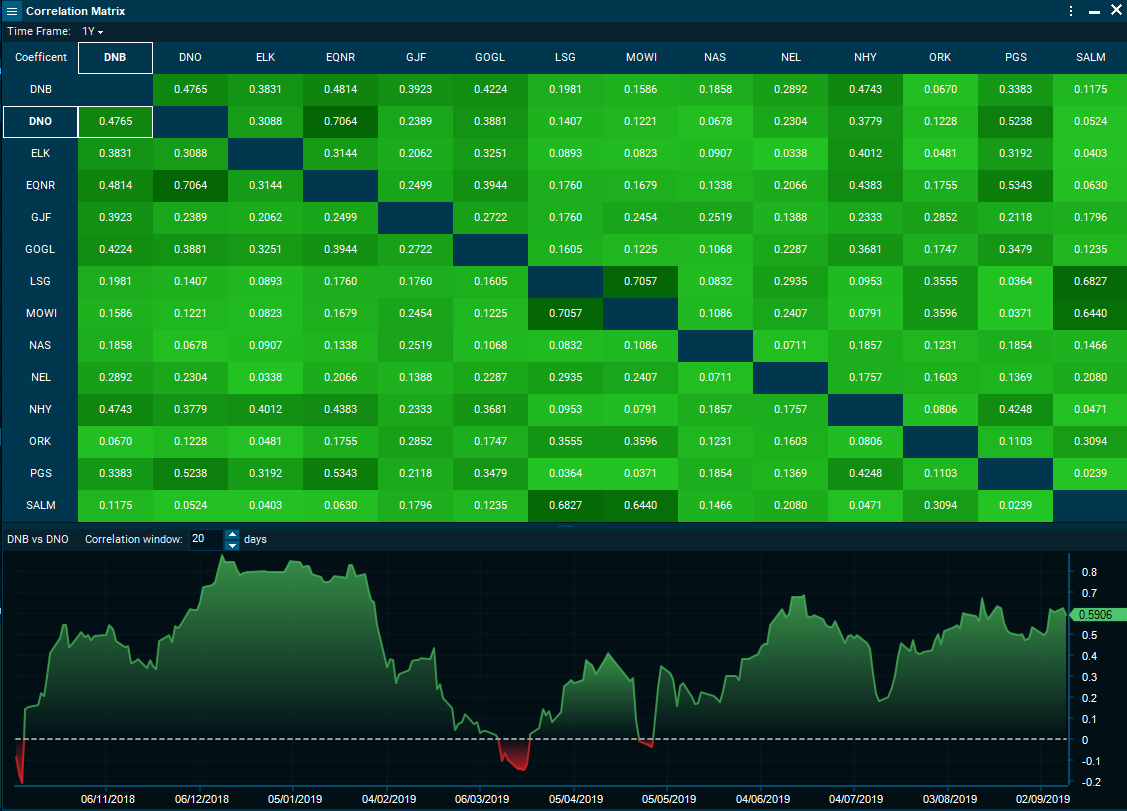
Matrix | Displays the cross-correlation across instruments as in "Pearson Correlation Coefficient". The coefficient displayed in the Matrix corresponds to the entire sample given the time frame selected at the upper left of the window. |
Coefficient | Each coefficient in the matrix can be selected. A single click will display a rolling coefficient, while a double click will display a comparison chart for the selected time frame. |
Rolling correlation | When a coefficient is selected, that is, Rho(Instrument A, Instrument B), a chart with a rolling coefficient will appear in the lower panel. The user can modify the size of the rolling window changing the number of "Correlation window". |