Chart Improvements
There have been significant chart feature enhancements and improvements.
Show events on directly on the chart line or on the time-axis:
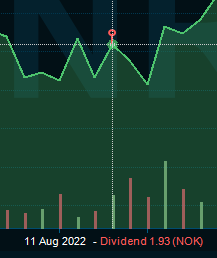
This is controlled by the new Position setting in the "Events" page of the "Chart Settings" dialog: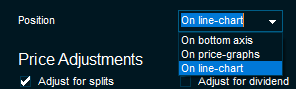
Merged "Trades" and "Order" study to one study named "Trading Activity", create settings selection list
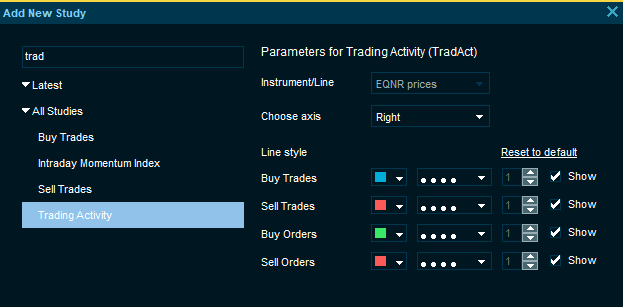
The new Trading Activity study replaces the four separate buy/sell trades/orders studies with just one study. When adding a trading study, the user will be prompted to login to a trading server, if not already logged in.The Fibonacci annotations now have settings for the different levels that can be adjusted by the user:
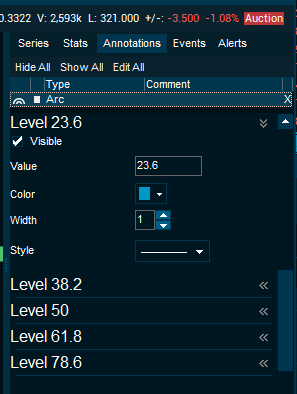
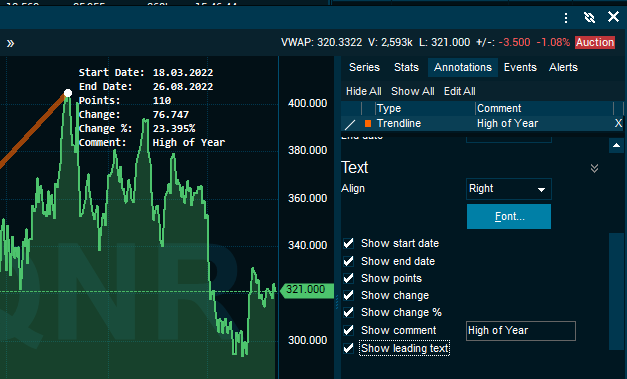
All annotation types now have a Text setting section that allows showing automatic and user controlled text next to the trendline or annotation in the chart:
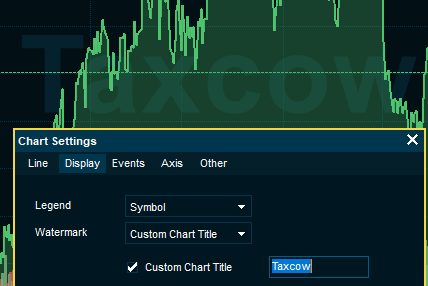
Setting to have a custom title shown as the watermark and window caption:
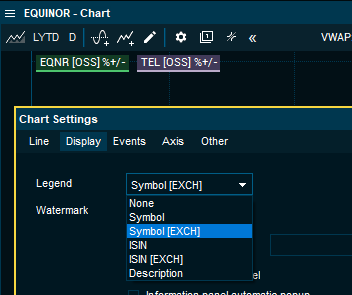
- Setting in Display page to control what is displayed in the chart legend:
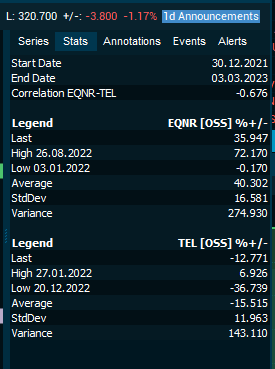
The Stats page in the chart data sidebar now also shows correlation data
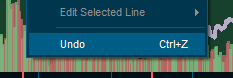
- Many operations, like adding studies or trendlines now supports an "Undo" command (<CTRL>+<Z>):
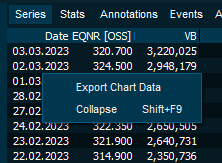
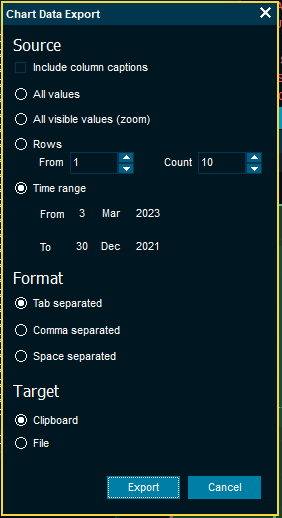
To make it easier to copy data from the Chart data panel, there is now new "Export Chart Data" wizard:
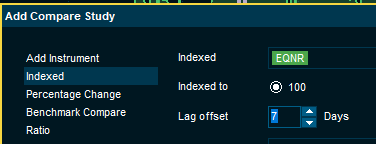
- It is now possible to introduce a lag offset in historical charts - can be used to align instruments with different time references
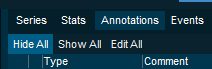
In the Annotations pane, it is now possible to easily hide or show all trendlines