
Chart
How to open
Intraday charts and historical charts can be opened in several ways:
- Right-click a symbol in a market window, watchlist or a market page and select "Charts and visualizations" > "Intraday chart" or "Historical chart".
- Search for "IntradayChart", "HistChart" or "Chart" in the "Find anything" search field.
- Use the shortcuts <CTRL>+<I> to open intraday charts and <CTRL>+<H> to open historical charts.
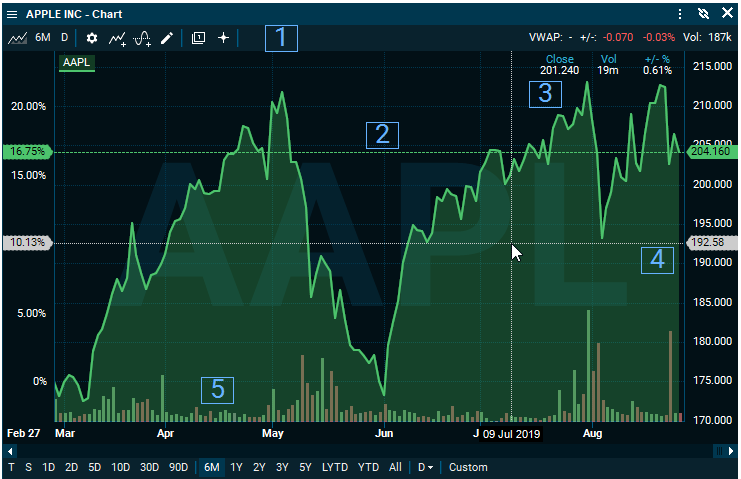
Default chart
Element | Description |
|---|---|
Toolbar (1) | Here you can find the cursor, chart templates, annotations, studies, compare studies, chart settings, resolution, time-period and chart type. |
Price line (2) | Visually indicates the current price level. |
Hover data (3) | When cursor is on, a data-table is displayed for the selected date. |
Hover price (4) | Shows the price level on the right axis. |
Volume bars (5) | Are displayed in the background as a visual indicator. |
Toolbar
Cursor

Turn on and off the cursor by clicking the "Show cursor" icon.
Templates

Find your templates by clicking the "Templates" icon.
Chart templates can be used for several purposes such as:
- Create a default charting layout
- Create different technical analysis templates
- Quickly change charting layout without manually removing or adding elements to the chart
- Create several color themes for different chart types
You can also restore factory default, save and load your templates. All your saved templates will be placed in your "ontrade\Setup" folder.
Settings

Change your chart settings by clicking the gear icon in the chart toolbar. From here, it's also possible to revert back to the old chart setup, used in Infront Professional Terminal in the 8.5 versions and earlier.
Among other things, allow you to:
- Choose axis
- Target currency
- Chart type (Area, Candle Stick, Line and so on)
- Line style
- Extend the chart
- Show chart data
- Show events
- Adjust for splits/dividend
- Change back to the legacy toolbar / summary bar
Annotations

Add annotations to your chart. This can be lines, channels, circles, arrows or for example long/short positions.
To change the coordinates, right-click on the annotations to prompt the different options.
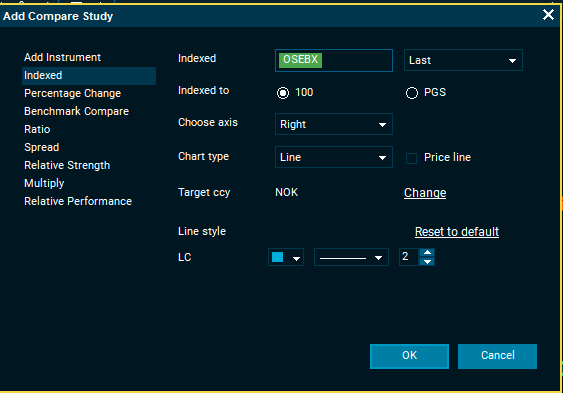
Add compare study

Compare studies to different instruments by choosing a study comparison. By adding an instrument, you can also change axis, currency or line style. The compare study can be also be indexed, see percentage change, benchmark compared and much more.
Add study

Add studies to your charts such as Moving Averages, Bollinger Bonds, RSI, Standard Deviation and much more. You can also select Instrument/Line, axis, period and line style for the different studies. The chart also updates in the background before clicking "OK", making it easy to see how the changes are reflected in the chart.
You do not have to press <CTRL> when using Line Snap. To use the Line Snap, make sure the cursor is turned on and mark a point on the chart to generate a starting point.
Resolution, time period and chart type

In the options in the top left, you can change chart type, time period and resolution.
Study definitions
| Study | Definition |
|---|---|
| Average True Range (ATR) | Measures volatility. High ATR often occur at market bottoms following a panic sell-off. Low ATR value is often found during extended sideways periods, such as those found at tops and after consolidation periods. |
| Chande Momentum Oscillator (CMO) | The indicator is created by calculating the difference between the sum of all recent gains and the sum of all recent losses and then dividing the result by the sum of all price movement over the period. This oscillator is similar to other momentum indicators such as the Relative Strength Index and the Stochastic Oscillator because it is range bounded (+100 and -100). |
| Commodity Channel Index (CCI) | Quantifies the relationship between the price, a moving average (MA) of the price, and normal deviations from that average. The index is scaled by a factor of 1/0.015 to provide more readable numbers. Therefore, it is essentially a MACD, normalizing the deviation. The CCI can be adjusted to the time frame of the market traded on by changing the averaging period. |
| Directional Movement DI+/DI- (DI) | Helps determine if a security is "trending". The DMI trading system involves comparing the 14-day DI+ ("Directional Indicator Up") and the 14-day DI- ("Directional Indicator Down"). This can be done either by plotting the two indicators on top of each other or by subtracting the DI+ from the DI-. Wilder, who developed the system, suggested buying when the DI+ rises above the DI- and selling when the DI+ falls below the DI-. |
| Directional Movement ADX (ADX) | ADX is an averaged combination of DI+ and DI- which serves as an indicator of the trend strength. The ADX is as an oscillator fluctuating between 0 and 100. Low readings (below 20) indicate a weak trend and high readings (above 40) indicate a strong trend. |
| Directional Movement ADXR (ADXR) | Quantifies momentum change in the ADX. It is calculated by adding two values of ADX (the current value and a value n periods back), then dividing by two. This additional smoothing makes the ADXR slightly less responsive than ADX. The interpretation is the same as the ADX; the higher the value, the stronger the trend. |
| Directional Movement DX (DX) | Combines the two DI+ and DI- lines of the DI analyses into one line. |
| High/Low Oscillator (HLO) | A simple model that uses today and yesterday's price to determine an oversold/overbought situation. If the HLO curve is above zero, it indicates an overbought situation. Similarly, if the HLO curve is below zero, it indicates an oversold situation. |
| Intraday Momentum Index (IMI) | The IMI is an oscillator which is constructed by averaging n day's worth of upward price changes (close is greater than open) to n day's worth of downward price changes (close is less than open). Sell signals are issued when the index crosses above the overbought level of 70% and buy signals are issued buy signals are issued when the index crosses below the oversold level of 30%. |
| Market Facilitation Index (FI) | Analyzes the amount that the price is changing for each unit of volume. It does not include any information concerning the direction of price changes. Instead, it is used to determine the efficiency with which the price is changing. The value of this indicator is the difference between the high and low prices divided by the volume. Therefore, its value tends to be very small. |
| Moving Average Convergence Divergence (MACD) | The MACD is calculated by subtracting a 26-day moving average of a security's price from a 12-day moving average if its price. A 9-day exponential moving average called "signal" or "trigger" line is plotted on the top of the MACD to show buy/sell opportunities. The result is an indicator that oscillates above and below zero. When MACD is above zero, it means that the 12-day MA is higher than the 26-day MA. This is bullish; since it shows that recent expectations (that is, the 12-day moving average) are more bullish than previous expectations (that is, the 26-day MA). This implies bullish (upward) shift in supply/demand lines. When MACD falls below zero, this implies that the 12-day MA is below the 26-day MA, implying a bearish (downward) shift in supply/demand lines. |
| Price Oscillator | Almost identical to the MACD except that it can use any two user-defined moving averages and can display the difference in either points or percentage (MACD displays only points). |
| QStick | Provides a way to quantify the amount and size of black and white bars in a candlestick chart. Black candlesticks represent a period when the price closed lower than it opened. Likewise, the white candlesticks represent a period when the price closed higher than it opened. |
| Rate of Change (RC) | Displays the difference between the current price and the price n time periods ago. The RC displays the wavelike motion in an oscillator format by measuring the amount that prices have changed over a given time period. As prices increase, the RC rises - as prices fall, the RC falls. The greater change in the price, the greater the change in RC. |
| Relative Momentum Index (RMI) | The RMI is a variation on the Relative Strength Index (RSI) that adds a momentum component. As an oscillator, the RMI exhibits the same strength and weakness of other overbought/oversold indicators. During strong trend markets, the RMI will remain at overbought or oversold levels for an extended period. During non-trending markets, the RMI tends to oscillate predictably between an overbought level of 70 to 90, and oversold level of 10 to 30 |
| Relative Strength Index (RSI) | The RSI is a price following oscillator that ranges between 0 and 100. A method for analyzing RSI is to look for divergence in which the security is making a new high but the RSI is failing to surpass its previous high. This divergence is an indication of an impending reversal. When the RSI then turns down and falls below its most recent trough, it is a confirmation of the impending reversal. |
| Relative Volatility Index (RVI) | The RVI measures the direction of volatility. The calculation is identical to the Relative Strength Index (RSI) except that the RVI measures a 10-day standard deviation of high and low prices instead of measuring period-to-period price changes. RVI rules of confirmation:
|
| Standard Deviation (SD) | The SD is a statistical measure of volatility. It is typically used as a component of another indicator. High standard deviation values occur when the data item being analyzed is changing dramatically. Low standard deviation values occur when prices are stable. |
| Stochastic Oscillator (SO) | The SO displays overbought and oversold levels. The SO consists of two lines where one is a 3-day average of the other. It should only be used in situations without a dominating tend. |
| Volatility (VOL) | The VOL indicator compares the spread between a symbol's high and low prices. It assumes that market tops are generally accompanied by decreased volatility, and that the latter stages of a market bottom are generally accompanied by decreased volatility. |
| Williams %R (WR) | The WR measures overbought/oversold levels. Very similar to Stochastic Oscillator, except that Williams %R is plotted upside down and the Stochastic Oscillator has internal smoothing. |
| Williams Accumulation/Distribution (WAD) | "Accumulation" is used to describe a market controlled by buyers. A market controlled by sellers is defined by "distribution". Williams recommend trading on divergences:
|