
Broker Statistics
"Broker Statistics" provides information on which brokers are purchasing and selling in the market. It also gives detailed information about how many trades the different brokers are doing, what their buy volume, sell volume and net buy volume is and so on. "Broker Statistics" are only available on:
- Stockholm Stock Exchange
- Copenhagen Stock Exchange
- Helsinki Stock Exchange
- Bolsa de Madrid, Equities
- Toronto Stock Exchange
How to open Broker Statistics
- Open one of the markets that display "Broker Statistics" > right-click one of the companies listed on the corresponding stock exchange > select "Trades & Orders" > go to "Broker Statistics".
- Select the company in the "Market" window > press <CTRL>+<SHIFT>+<B> on your keyboard.
How to use Broker Statistics
Realtime and historical data
The broker statistics module provides you both real time (intraday) and historical data. To change the time period, right-click and select "Interval". Historical data is available for up to three years.
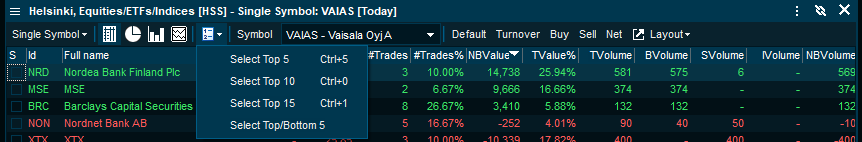
Select criteria to drill down
Use the "Show" drop-down list to select a range of brokers you want to see visually, or select the checkboxes to the left of the broker codes.
Ranking Bar Chart
Click the "Ranking Bar Chart" icon to rank the brokers by preferable factor.
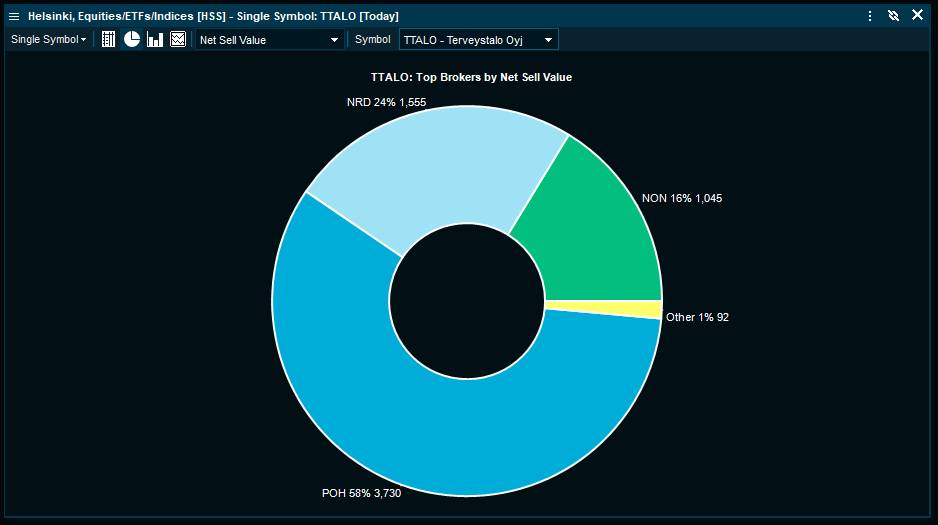
Ranking Pie Chart
The "Ranking Pie Chart" provides a visual representation of all broker statistics data.
All Brokers / Single Symbol
You can select between the following views.
All brokers
Statistics for one market where all information about each broker is accumulated. In the "Table" view, each broker is represented with a number of trades executed, turnover and more.
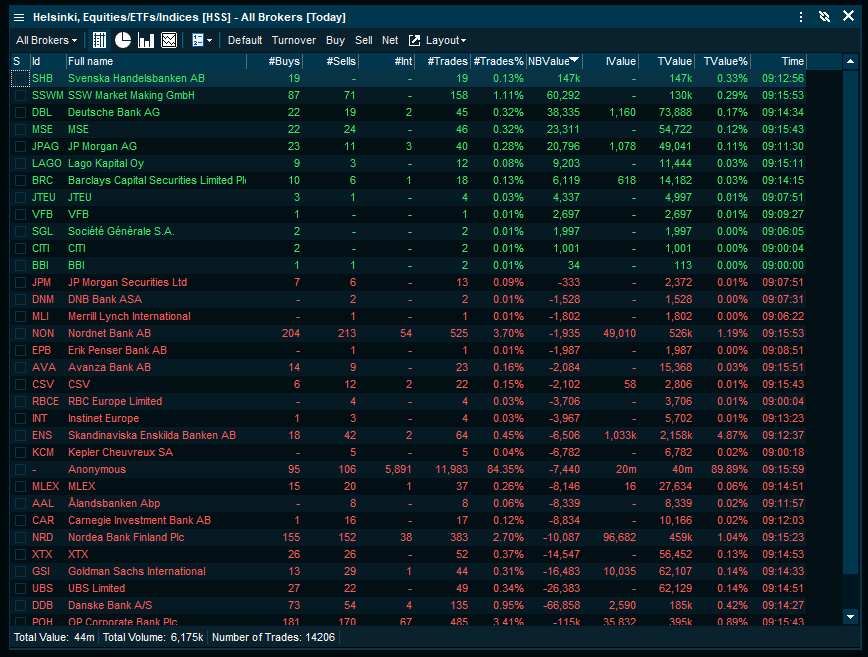
Available columns
- S (checkbox for Timeline Selected)
- Full name (the broker's name)
- ID (the broker's ID)
- Time (time of last trade/update)
- #Buys (number of Buy Trades)
- #Sells (number of Sells Trades)
- #Int Trades (number of Internal Trades)
- #Trades (total number of trades)
- #Trades % (trades shown in percent of total trades)
- NB Value (Net Buy Value)
- IValue (Internal Value)
- TValue (Turnover Value)
- TValue% (Turnover Value in percent)
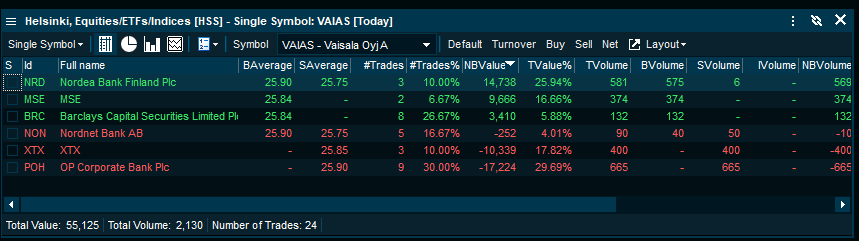
Single Symbol
Statistics for one symbol where all active brokers activity is accumulated. This view displays accumulated data on all brokers active for the selected symbol. This enables you to get fast access to the brokers that are the largest buyers, sellers, most active and so on.
Available columns
- S (checkbox for Timeline Selected)
- Full name (the broker's name)
- ID (the broker's ID)
- Time (time of last trade/update)
- #Buys (number of Buy Trades)
- #Sells (number of Sells Trades)
- #Int Trades (number Internal Trades)
- #Trades (total number of Internal Trades)
- #Trades % (trades shown in percent of total trades)
- NB Value (Net Buy Value)
- IValue (Internal Value)
- TValue (Turnover Value)
- TValue% (Turnover Value in percent)