Bar Chart
Description
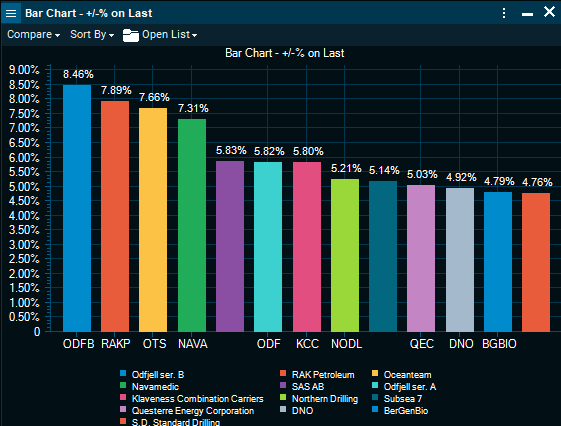
The bar chart displays one or more instruments side-by-side. By default, it will display the selected instruments net change in percent. It can be configured to chart a number of historic values in order to quickly compare the instruments' performance against each other.
How to access
Select a range of symbols in a "Market" window, "Composite" window or a "Market Page" and select "Charts & Visualizations" > "Bar Chart".