
ATR-based day-trading signals
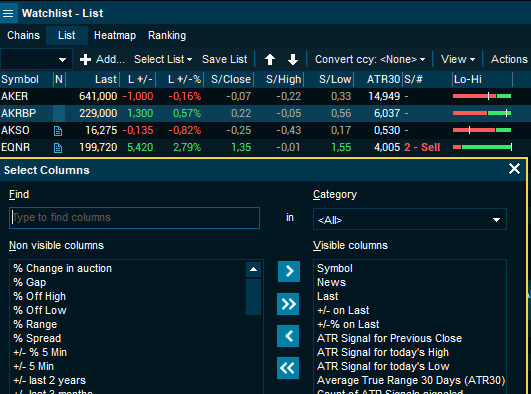
We have introduced four new columns related to the calculation of ATR-based day-trading signals.
Using the values of these columns (and the possibility to sort or filter to only see the interesting signals) can help you make decisions about when to buy or sell securities in the market.
ATR30 (Average True Range 30 days) is a column we already support. It gives a measure of how much volatility there is typically/statistically the last 30 days in terms of nominal price changes.
This is used as the basis of calculating how much volatility there is in today's trading (measured in number of ATRs). There are three such measurements:
- Change between previous close and high (S/High)
- Change between previous close and low (S/Low)
- Change between previous close and the current last price (S/Last)
Each of these is a signal, but only those signals above a minimum strength are of interest. This is set to 1 ATR by default, but it can be configured in the settings to a value between 0.75 and 2 ATRs.
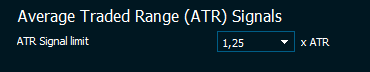
That limit settings indicates how aggressive or conservative you want to be in interpreting the signals.
The fourth column (S/#) is an aggregated count that will be 0, 1 or 2. It indicates how many of the three signals above currently have a value exceeding the ATR Signal limit.
It can be convenient to sort on or filter on this signal count column to see only the ones with 1 or 2, because these will be the "interesting" cases in your universe of instruments (a market list or watch list). Normally, only a signal count of 2 should be considered a confirmed trigger.
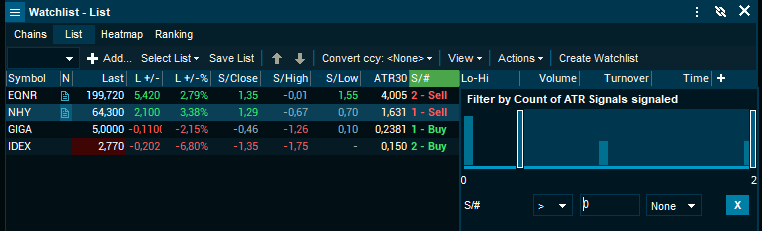
The count column will be red for a sell signal and green for a buy signal. The signal will be opposite of the recent (possibly exuberated) movement, the theory being that it will return to normal.
The different ATR signal columns will show a hint with additional detailed information. This can be useful to optimise space by reducing the number of columns shown, while still being able to quickly look at the details behind any of the scores:
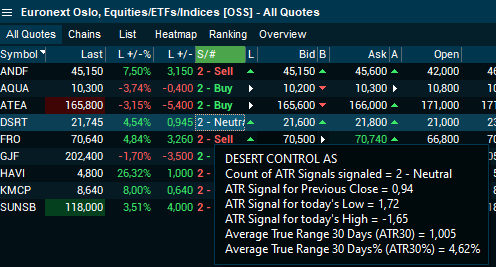
Notice that in some cases there can be two opposite scores, giving a score count of 2, but tagged as neutral.
To drill down further and see how the broken ATR levels show themselves in an intraday chart, it is possible to add various horizontal lines.
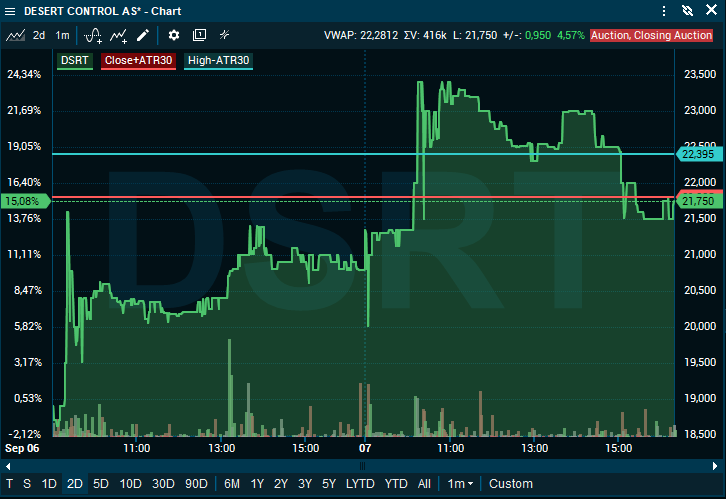
The chart above shows that intraday trading first broke the PrevClose+ATR limit (blue line), then it broke down falling below the High-ATR level (red line) - giving in total a neutral signal now. Earlier in the day, it would probably have given a sell signal.
Always consider other factors, such as fundamental news, and other technical indicators before making a trading decision.