Saisonalitäts-Matrix
Öffnen
Klicken Sie mit der rechten Maustaste auf ein Instrument und wählen Sie > "Charts & Visualisierung" > "Saisonalitäts-Matrix".
Bedienung
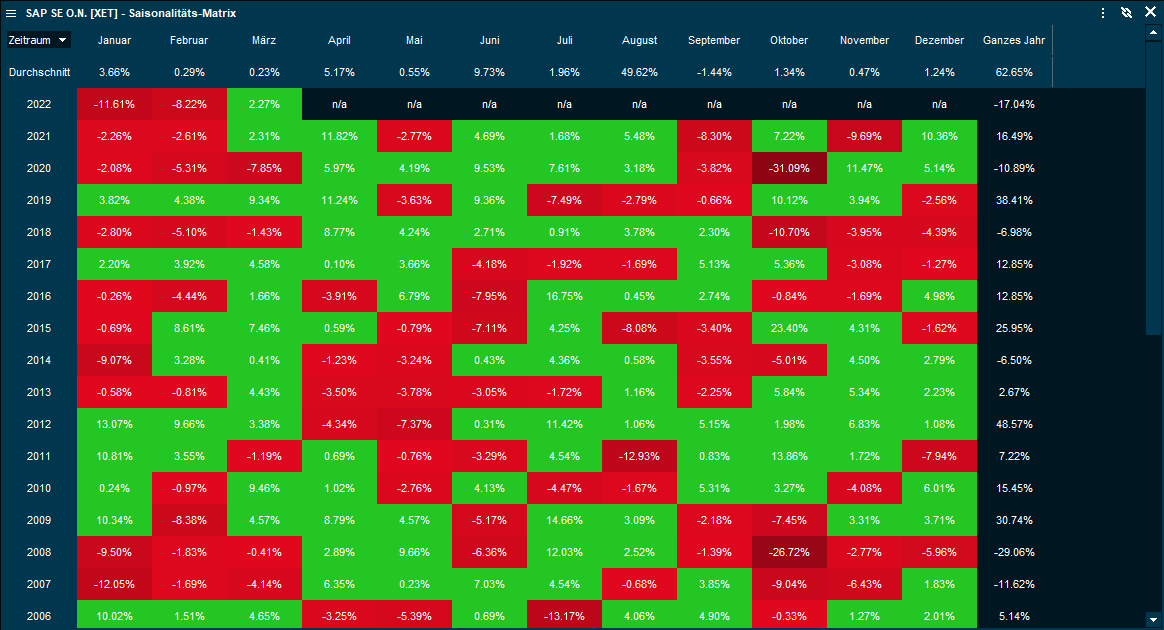
Die Saisonalitäts-Matrix bietet einen grafischen Überblick über die bisherige Performance für bestimmte Monate und Jahre.

